Vaccination and the Control of Seven Infectious Diseases in the US (1900-1970)

1. Introduction
2. Infectious Disease in US (1900-1970)
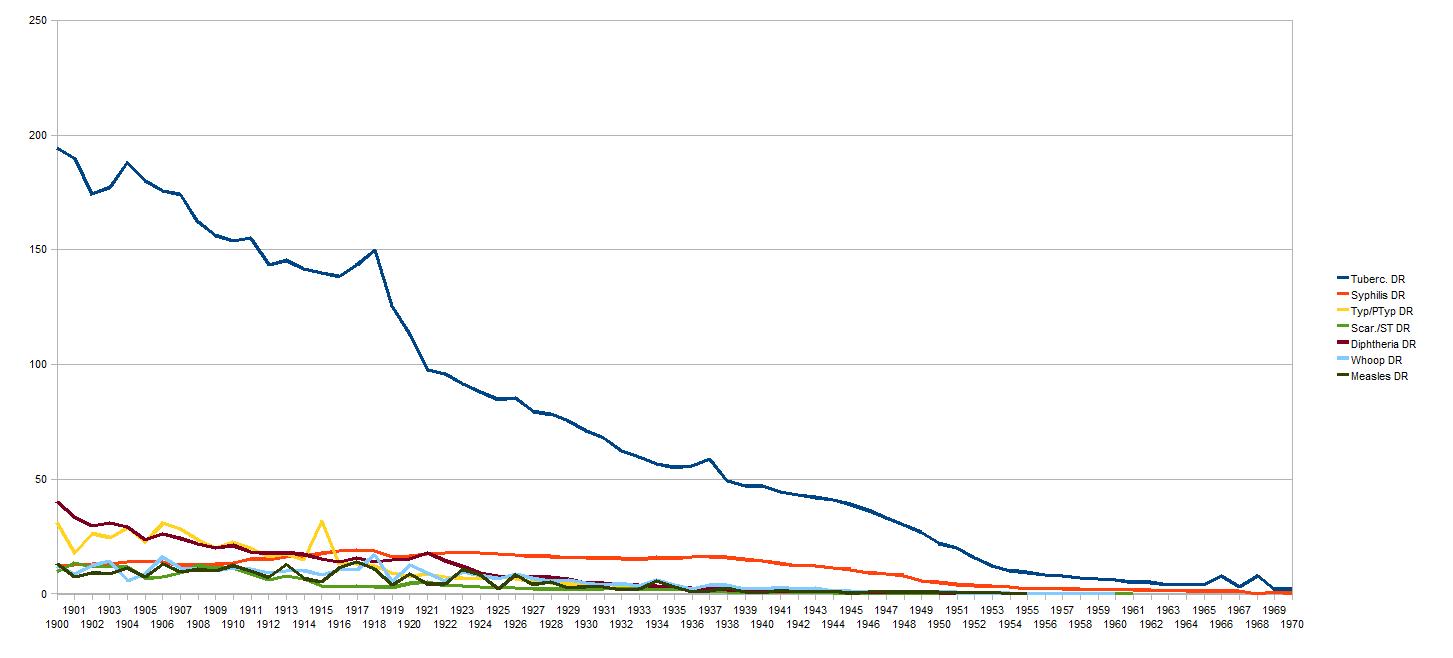
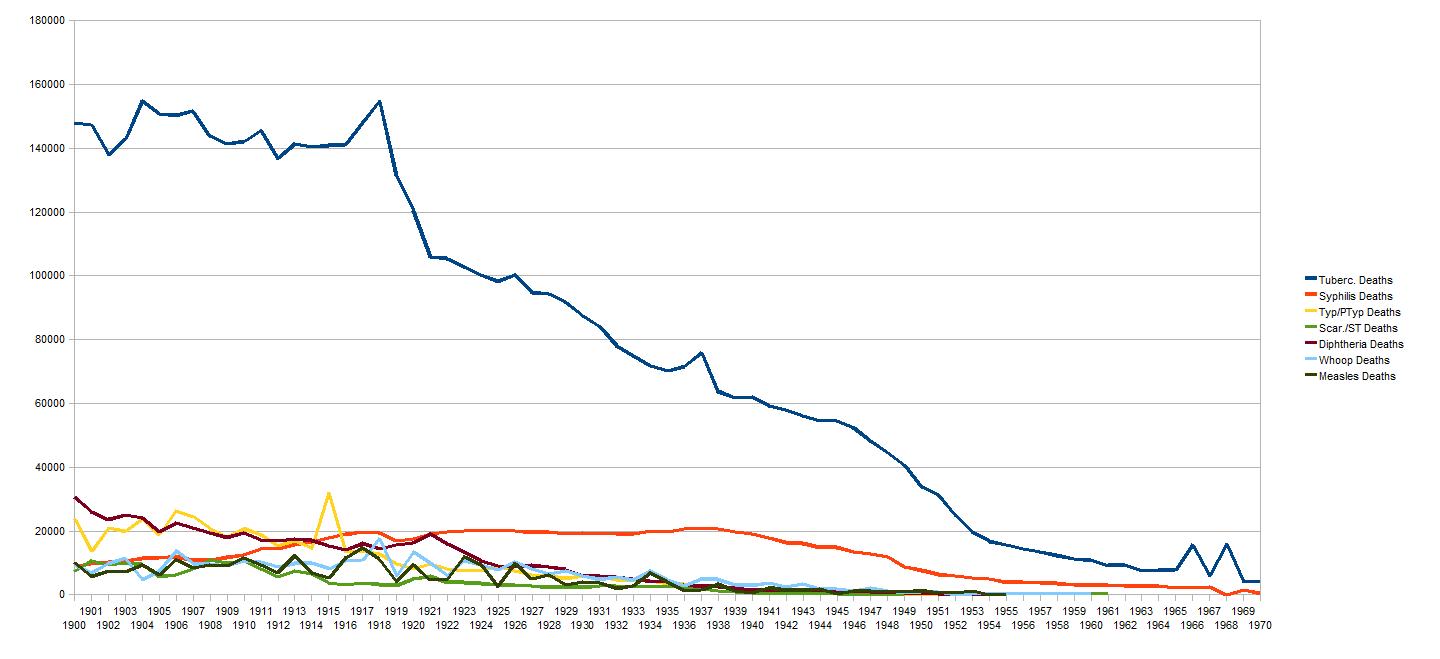
3. Infectious Disease Deaths in US (1900-1970)
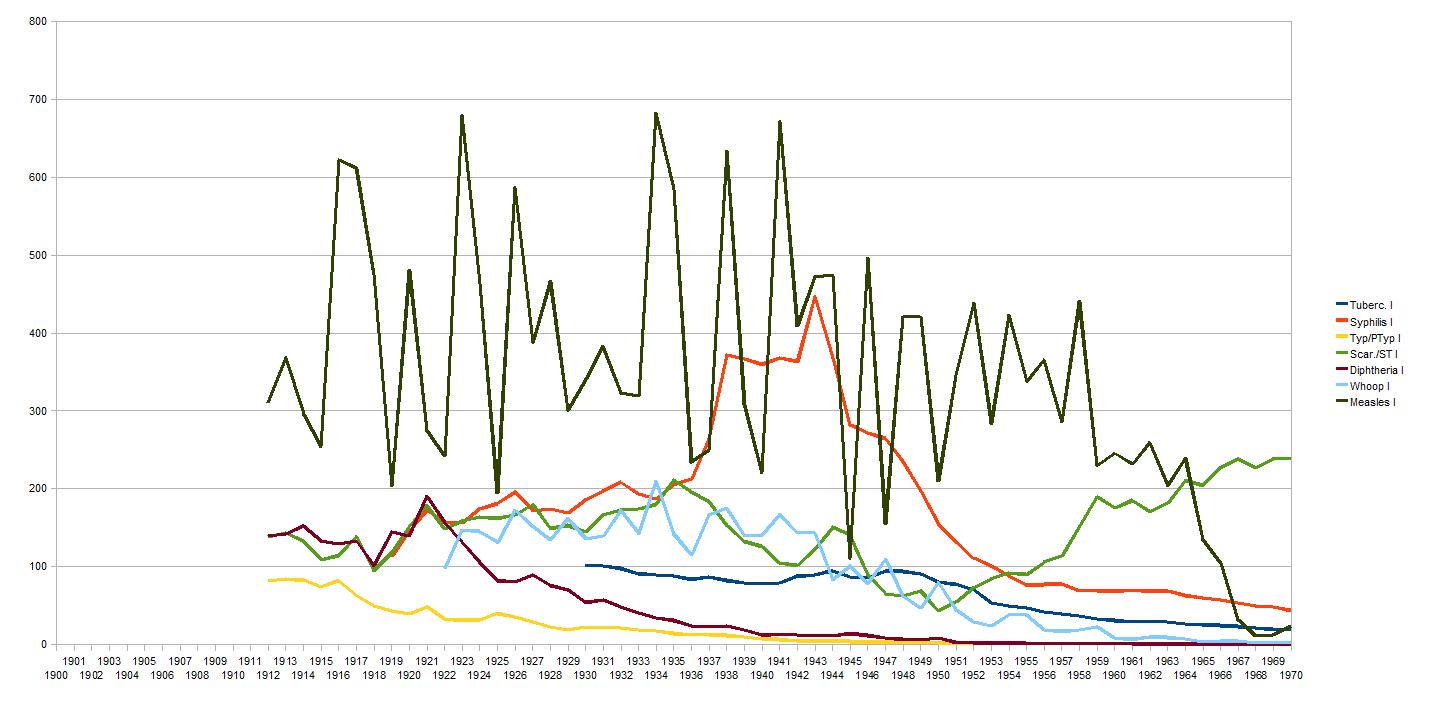
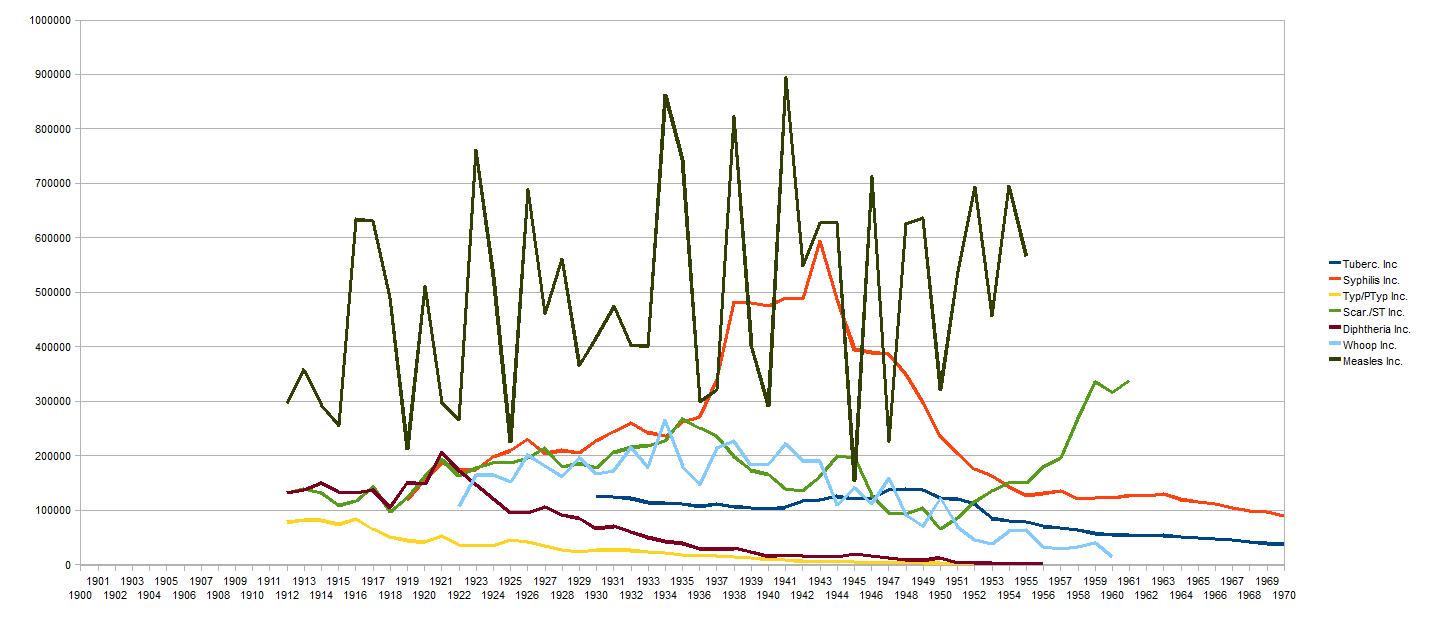
4. Infectious Disease Incidence in US (1900-1970)
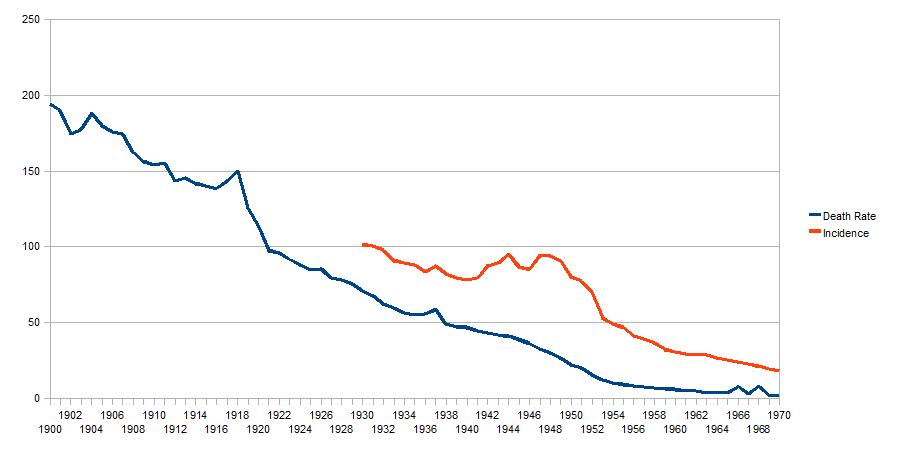
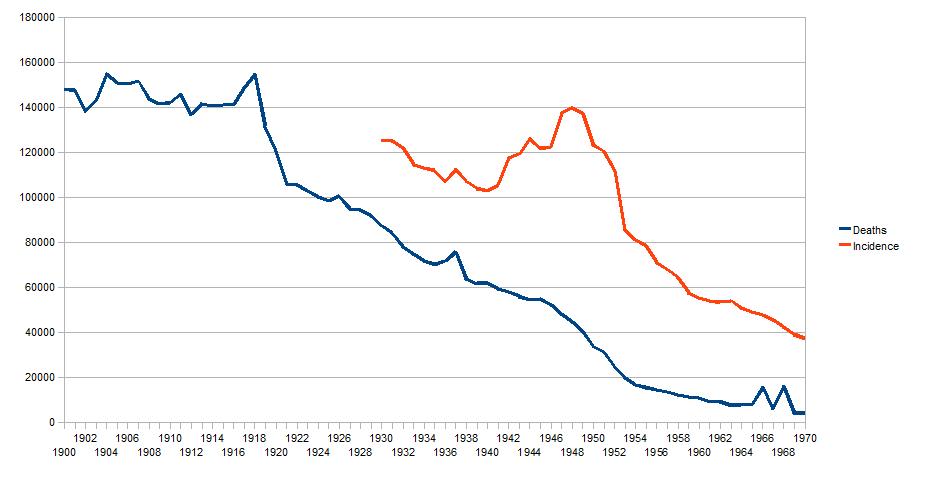
5. Tuberculosis in US (1900-1970)
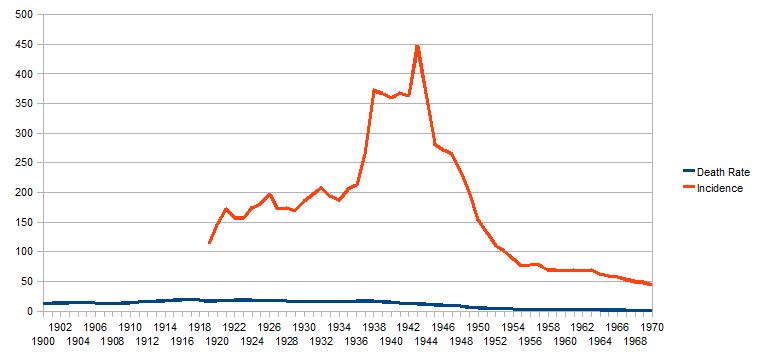
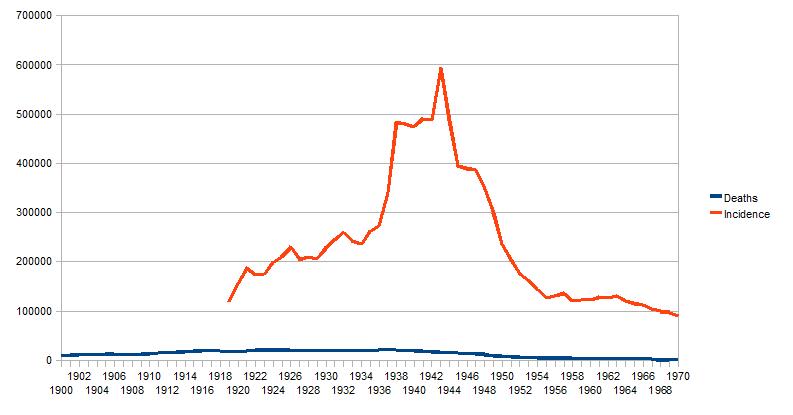
6. Syphilis in US (1900-1970)
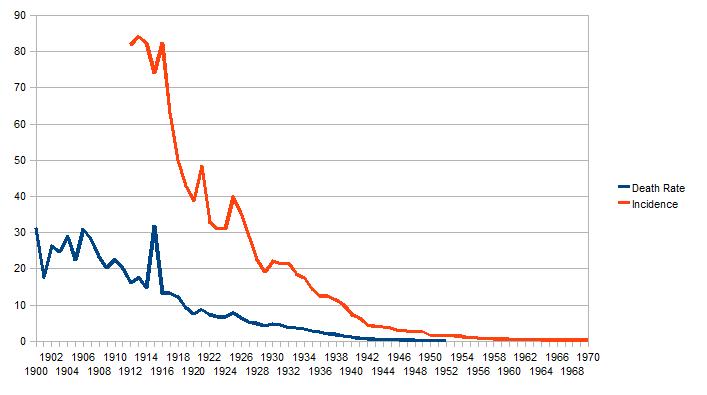
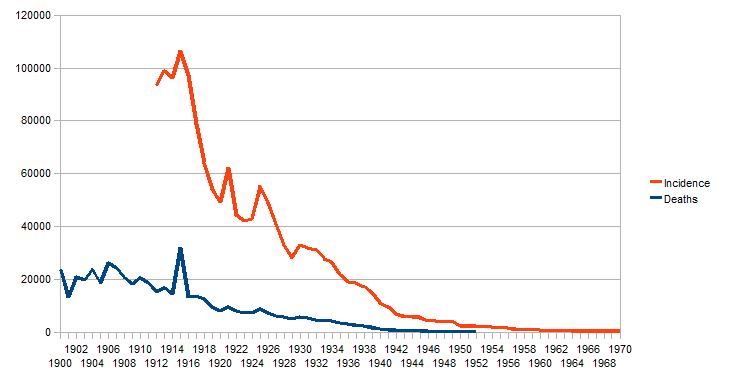
7. Typhoid & Paratyphoid in US (1900-1970)
8. Scarlet Fever & Strep. Throat in US (1900-1970)
9. Diphtheria in US (1900-1970)
10. Whooping Cough in US (1900-1970)
11. Measles in US (1900-1970)
12. Massachusetts - Infectious Disease Data (1860-1970)


1: Introduction

Commentary by Dr. Brian Blood

This file includes publically available data drawn from Historical Statistics of the United States Colonial Times to 1970 (http://www2.census.gov/prod2/statcomp/documents/CT1970p1-03.pdf) for the following infectious diseases:

1. Tuberculosis (TB)
2. Typhoid & Paratyphoid
3. Scarlet Fever & Strep. Throat
4. Diphtheria
5. Whooping Cough (Pertussis)
6. Measles
7. Syphilis

Influenza is not included in any of these tables or totals.
 
By combining incidence and death rates with population figures it has been possible to estimate the number of deaths for each disease in each year between 1900-1970.
In addition, Massachusetts data (1860-1970), also taken from the same source, provides information about the death rates for various infectious diseases from the middle of the nineteenth century.
 
From the data in Historical Statistics of the United States Colonial Times to 1970 we confirm that, in 1900, about 230,000 people (0.3% of the population, i.e. 1 in approx. 330) died of the effects of six infectious diseases (tuberculosis, typhoid fever, scarlet fever, diphtheria, whooping cough and measles). This total did not fall below 200,000 (by then 0.2% of the population, i.e. 1 in 500) until 1919, after which there was a steady decrease to just below 100,000 (by then 0.08% of the population, i.e. 1 in 1250) by 1931.  The total fell below 50,000 in 1947.   These diseases rarely if ever cause death in the US today.

It should be understood that those facing the greatest risk of deaths from infectious disease were neonates and young children. In the UK, in 1901, 36.2% of all deaths and 51.5% of childhood deaths were from infectious diseases. By contrast in 2000, 11.6% of all deaths and only 7.4% of childhood deaths were from infectious diseases. Infectious diseases were a significant cause of childhood mortality in British cities until about 40 years ago and the position in the US was unlikely to have been very different. Several factors, including vaccination, antibiotics and improved sanitation, have contributed to this trend.

ref: http://journals.cambridge.org/action/displayAbstract;jsessionid=85A27FF09D2D3D23CACC87A1AD380D0E.tomcat1?fromPage=online&aid=350203
 
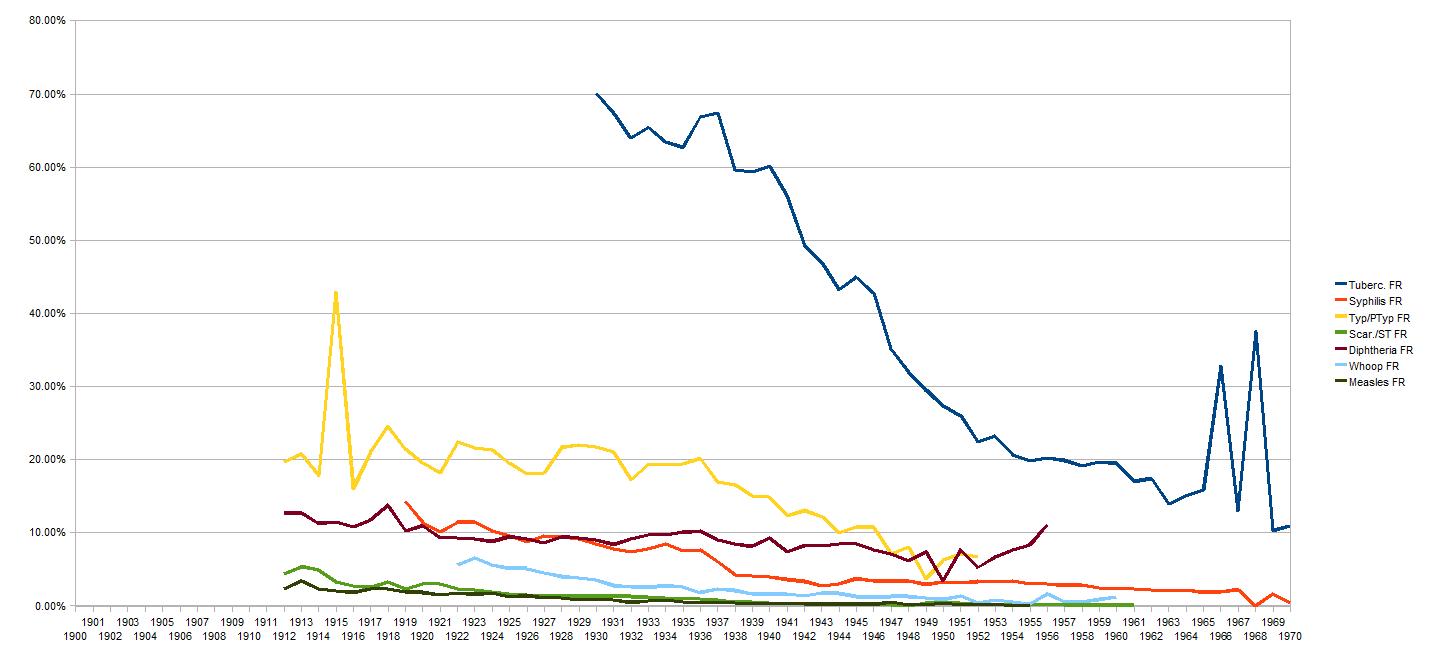
The US infectious disease data is recorded using two indices - incidence (the number of confirmed cases in one year of a specific infectious disease per 100,000 of the general population) and death rate (the number of people the disease kills in a year per 100,000 of the general population). From this data a third index may be derived, the fatality rate (death rate/incidence) which is a measure, in a particular year, of the chance that an infected individual will die of as a result of infection.
 
When explaining why incidence and death rates fell, commentators point to improvements in two areas, sanitation and hygiene.
 
For example, http://www.encyclopedia.com/doc/1O119-HygienePersonal.html, surveys the changing approach to hygiene in the US.

"Improvements in hygiene habits were rooted in technological innovations and changed attitudes. From the early nineteenth through the mid-twentieth centuries, the gradual spread of municipal water and sewage systems and the growing availability of indoor plumbing, hot water heaters, washing machines, and commercially manufactured soaps - developments that extended outward from urban centres to small towns and rural regions, and down the social scale from the elite to the poor - marked a major transition in hygiene, making possible higher standards of personal cleanliness, less exhausting laundry procedures, and the sanitary disposal of human wastes.

By the 1920s, reformers concerned with immigrant assimilation successfully made cleanliness a hallmark of being "American." But it was the producers of hygiene products and household cleaning appliances, for whom cleanliness meant profits, who persuaded American consumers to accept nothing less than perfection, to look for "the cleanest clean possible." Incessant advertising appeals in magazines, on radio, and later on television created a culture of cleanliness that by the 1950s set Americans apart. With houses cleaner and bodies better groomed than ever before, cleanliness became an obsession. Dependence on daily showers, sensitivity to body odours, desire for immaculately clean houses, and preoccupation with teeth that gleamed distinguished Americans as a people."

The best indicator of improvements in sanitation and hygiene is typhoid fever. Sanitation and hygiene are critical to the prevention of typhoid. Typhoid does not affect animals and therefore transmission is only possible from human to human. Typhoid can only spread in environments where human faeces or urine are able to come into contact with food or drinking water.

An article in Health, a publication of the Water Quality & Health Council to the Chlorine Chemistry Division of the American Chemistry Council, entitled A Public Health Giant Step: Chlorination of U.S. Drinking Water reports on a recent study of disease rates in cities during the late 19th and early 20th centuries.

"A 2004 statistical study of disease rates in cities found clean water to be the reason for rapid declines in urban death rates during the late 19th and early 20th centuries. The study concludes that clean water was responsible for "nearly half of the total mortality reduction in major cities, three-quarters of the infant mortality reduction, and nearly two-thirds of the child mortality reduction." The study puts forth a striking finding - that chlorination and filtration reduced typhoid fever by 91% within 5 years, leading to its near-eradication by 1936."

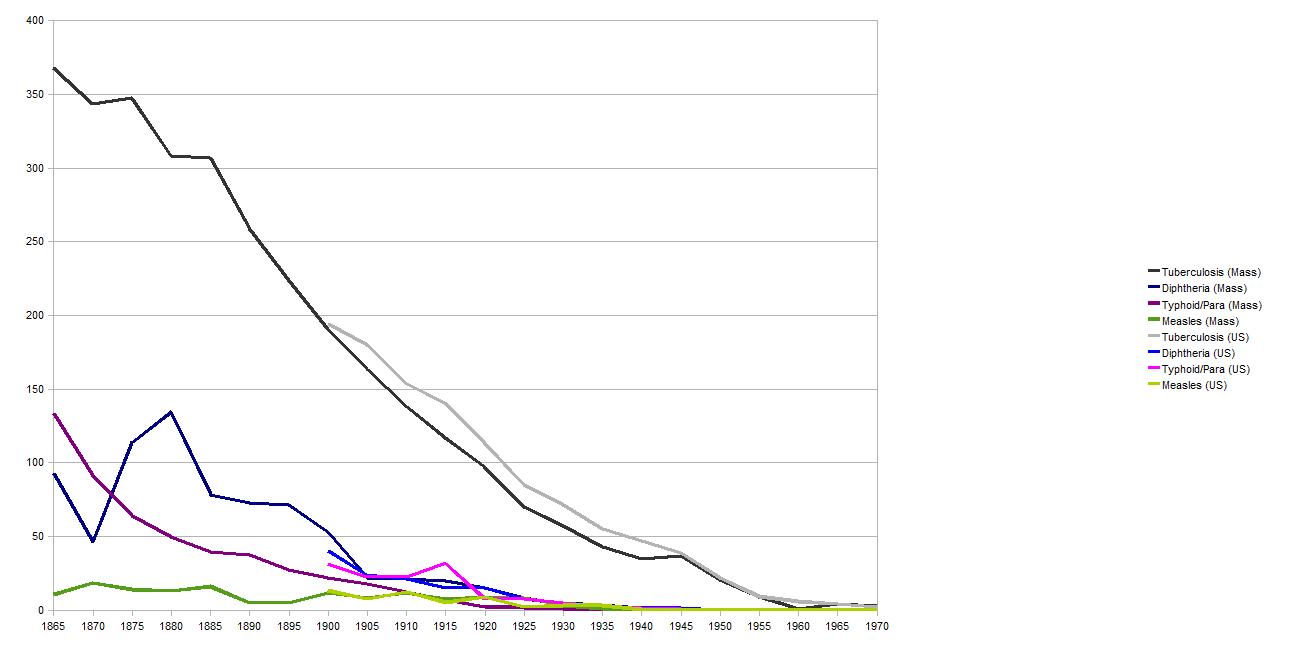
The Massachusetts data confirms a falling death rate for typhoid fever throughout the second half of the nineteenth century which continued throughout the first half of the twentieth century. The US data confirms with an unchanging fatality rate that there had been little progress in the care and treatment of those who contracted this fearsome disease, at least until the introduction of antibiotics into clinical practise in 1942.

The Massachusetts data confirms that typhoid death rates had fallen to below 10% of the 1865 levels by 1910 and to below 1% of 1865 levels by the end of the 1920s.  We can argue that incidence levels were falling at a similar rate because the US fatality rate remained at around 20% from 1912 to 1937.
If poor sanitation and hygiene were at the root of every infectious disease then one would expect to see parallel falls in the incidence rates for every disease over a similar course of time. 
The absence of any correlation between reductions in the incidence of typhoid fever and any particular infectious disease might suggests that hygiene (drinking water quality and effective modern sewerage systems) is not specifically related to the epidemiology of the disease or its pathogen.
Syphilis is a special case where we would be unlikely to find any correlation - and indeed there is none.
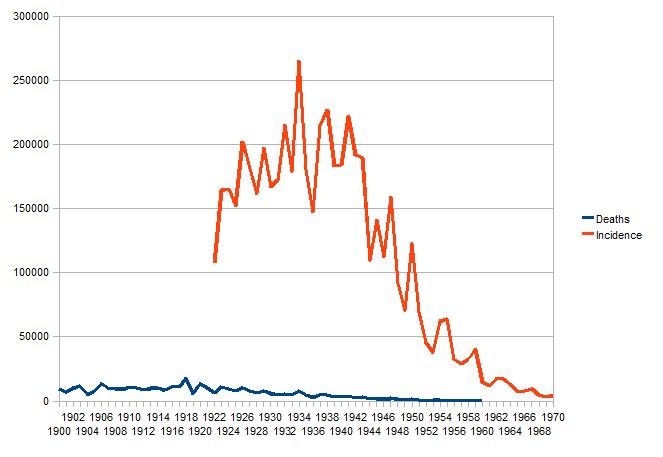
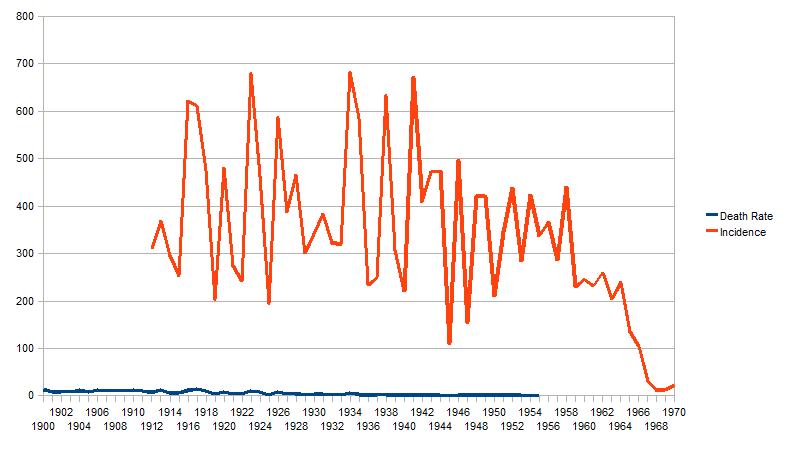
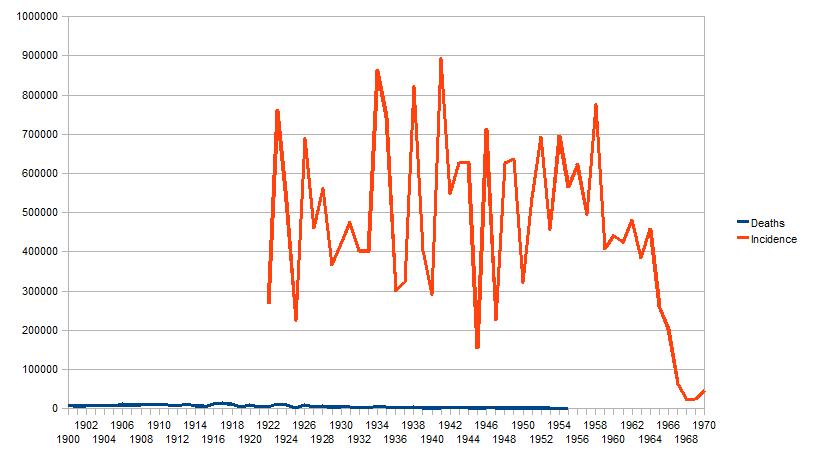
Measles is the most striking.  Although variable from year to year the mean incidence rate remained unchanged until the 1960s after which it fell rapidly to a historically low level.  A measles vaccine was introduced in 1963.
In the US, whooping cough incidence (showing its characteristic 3 to 4 year cycle) only fell significantly from the mid-1940s which is when vaccination was introduced.
Diphtheria incidence certainly dropped from the time vaccination was introduced in the early 1920s.  Of course, during that period typhoid incidence too was still falling (although from historically low incidence levels). One might argue, and some do, that all the reduction was due to improvements in hygiene.

For example see The Real Truth: Vaccination Inefficacy in the Reduction/Elimination of Infectious Diseases by Roman Bystrianyk:

"The Vital Statistics of the United States contains compiled statistics for a wide variety of information since early in the 1900s. Among those are death rates from all diseases, including infectious diseases. An introductory statement from the 1937 statistics indicates that death rates from infectious diseases declined greatly in the early part of the century. These declines occurred well before the advent of vaccines to treat these conditions.

The trend in death rates for specific causes, over the past 20 or 30 years, may be characterized by two general statements. In the first place, there has been a great reduction in the death rates for infectious and preventable diseases; in the second place, there has been an increase in the rates for certain diseases characteristic of older ages. Greatest proportional rate decreases have taken place for such diseases as typhoid and parathyroid fever, which has declined from a rate of 23.5 in 1910 to 2.1 in 1937; and diphtheria, which declined from a rate of 21.4 in 1910 to 2.0 in 1937. ... The rate reductions for infectious and preventable diseases can be largely attributed to the development of modern public-health practice.

From these figures, we can see that death rates from typhoid decreased by 91% from 1910 to 1937 and death rates from diphtheria declined by 90.5% during the same time period. The decrease in diphtheria occurred well before the use of vaccination."
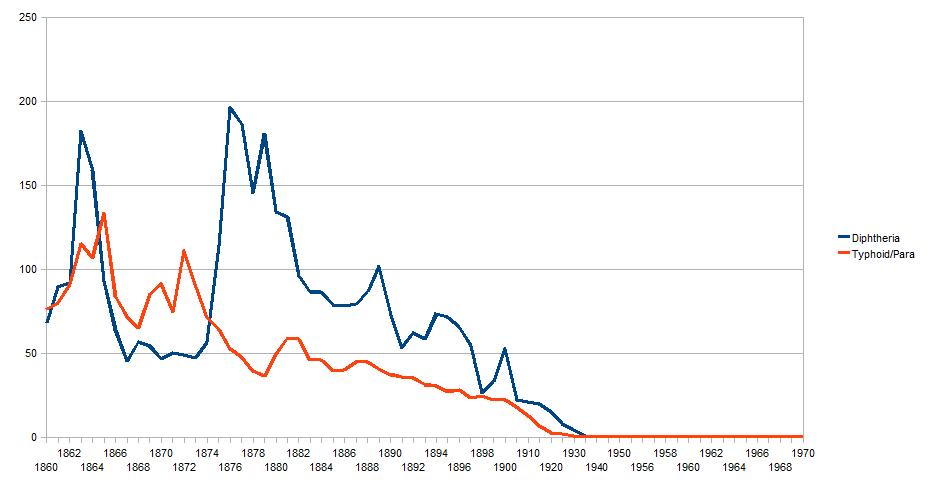
Table 1. Death Rates for Diphtheria and Typhoid Fever in Massachusetts from 1865 to 1970
The Massachusetts' data shows just how selective this comparison is and how the author has chosen to look at a time period that might support his supposition while ignoring the data set as a whole which does not.

(i) Diphtheria is not caused by a water-borne pathogen; (ii) Massachusetts data shows that the reduction in deaths rates for typhoid fever and diphtheria follow only a generally common downward trend; (iii) for example, in Massachusetts, from 1870 to 1880 the typhoid fever death rate fell (from 91.5 to 49.5) while the diphtheria death rate increased (from 46.4 to 134.3); (iv) the fatality rate held steady at about 8% even after the introduction of vaccination (vaccination has no effect on the fatality rate); (vi) from 1920 the fall in the death rate parallels the fall in incidence. The data suggests strongly that the fall in the death rate from early 1920 was direct related to a fall in incidence which is the means by which vaccination reduces the death rate.

Scarlet fever and strep. throat data were collected under a single heading from 1920.  Scarlet fever is of course caused by streptococcus pyogenes.  During the second half of the nineteenth century a spontaneous fall in scarlet fever mortality was the result of a variation in the virulence of heomolytic streptococcus. From 1900 the incidence of streptococcus infection did not materially fall. Indeed it would appear that by 1970 it was again on the increase.  Fortunately, the availability of penicillin and other antibiotics has meant that strep. infections are no longer regarded as life-threatening to either young children or adults.
Tuberculosis incidence remained high through to the 1950s after which it began to fall.  This coincides with the introduction, in the US, of the BCG vaccine.

Pasteurization, the process of heating a liquid to below the boiling point to destroy microorganisms, was developed by Louis Pasteur in 1864 to improve the keeping qualities of wine. Common milk-borne illnesses during that time were typhoid fever, scarlet fever, septic sore throat, diphtheria, and diarrhoeal diseases. The commercial implementation of pasteurization, in combination with improved management practices on dairy farms, virutally eliminated milk as a source of these illnesses. In 1938, milk products were the source of 25% of all food and water-borne illnesses that were traced to sources, but now they account for far less than 1% of all food and waterborne illnesses.

Commercial pasteurization of milk began in the late 1800s in Europe and in the early 1900s in the United States. Pasteurization became mandatory for all milk sold within the city of Chicago in 1908, and in 1947 Michigan became the first state to require that all milk for sale within the state be pasteurized. In 1924 the U.S. Public Health Service developed the Standard Milk Ordinance to assist states with voluntary pasteurization programmes.

[taken from History of Pasteurization]

There is no doubt that historically hygiene has played the greatest role in reducing the number of deaths from infectious diseases, and to measurable improvements in expectation of life and no one would deny this. But we are not trying to make a choice between two competing strategies, which is what opponents of vaccination would have us do. Even once all the benefits of modern hygiene were in place, infectious diseases continued to kill and, in considerably larger numbers, maim neonates and children. From the beginning of the twentieth century, advances in medical treatment and care improved survivability but at considerable emotional and financial cost to patients, their families and, where state-financed care was available, through taxation of the local community. If the most effective way of overcoming these multiple burdens was to reduce the incidence of infectious diseases then vaccination offered the best means of achieving it. Where possible, as in the case of smallpox, by this means, the disease might even be eradicated altogether.

An article by Dr. Pat Kendall entitled Nutrition Comes of Age in the 20th Century points out that nutrition, which was barely a science at the turn of the century, would bring great advances in the discovery of essential nutrients, their roles in preventing disease and the translation of this information into nutritional policy.

Food restrictions and shortages during World War I created the need to ensure we were providing for the nutritional requirements of our soldiers and workers. In 1917, the U.S. Department of Agriculture issued the first dietary recommendations based on five food groups. In 1924, iodine was added to salt to prevent goitre. With that change, the rate of goitre in Michigan, for example, quickly fell from 39 to 9 percent.

The great depression of the 30s led to the development of food relief and food commodity distribution programs, including school meal and nutrition education programs, and national food consumption surveys.

The 30s also saw continued growth in the incidence of pellagra. Commonly described as the 4D disease for diarrhea, dermatitis, dementia and death, pellagra was originally considered an infectious disease and reported as such in public records. Between 1906 and 1940 some 3 million cases and 100,000 deaths in the United States were attributed to pellagra. In 1937, researchers confirmed that pellagra was not an infectious disease caught from someone else, but the result of insufficient niacin in the diet. This led to the adoption of public policy to enrich all flour with niacin, along with iron, thiamin and riboflavin. By the end of the 1940s pellagra was a disease of the past.

The 1940s was a time of great interest in nutrition. Our country was again engaged in war, food was rationed and as many as 25 percent of those drafted into the military showed evidence of past or present malnutrition. A program to fortify milk with vitamin D was instituted, followed by a decline in the incidence of rickets.


The association between TB and malnutrition has long been known. TB makes malnutrition worse and malnutrition weakens immunity, thereby increasing the likelihood that latent TB will develop into active disease. Robert Lee writing about social conditions in nineteenth century Europe (A Companion to Nineteenth-century Europe (2006)) summarises the work of Mckeown and others on determinants of mortality change in England, Wales and other European countries: "The fall in tuberculosis mortality was already evident before 1851, but its downward trajectory was not the result of changing exposure levels, housing improvements, or sanitary reform, but was attributable to increased per capita food supply." He goes on, however, to discuss criticisms of this explanation which many have argued is too simplistic ignoring, as it does, psychological stress (due to over-crowding and poor housing), urbanisation, human agency (quarantine, cordons sanitaires, the development of modern hospitals following Lister's antiseptic principles) and the benefits accruing from the reduction in sanitation diseases (typhoid, cholera, malaria). Lee is also critical of the assumption that the factor leading to a fall in TB mortality rates were necessarily due to increased levels of nutrition. After all, the mortality rates due to TB were as high among the better-fed elite as among the nutritionally disadvantaged poor.
 

To make an informed choice we need to understand the benefits of vaccination in an age when relatively few people contract these infectious diseases, and the real rather than the imagined risks of the vaccination process and of the various vaccines themselves.
 
By distorting the outcome of manifestly successful vaccination programmes from the past, anti-vaccination sites (often masquerading as Vaccination Information Centres, Vaccine Awareness Network, etc.) do no service to those who rightly need to make 'informed' choices on behalf of their children.
This page in Wikipedia (http://en.wikipedia.org/wiki/Vaccine_controversy) points to some of the problems in the way the controversy has been handled and the fundamental antipathy to science-based (now called evidence-based) medicine from certain parts of the complementary and alternative medicine (CAM) movement.  
Further reading: Understanding Infectious Diseases
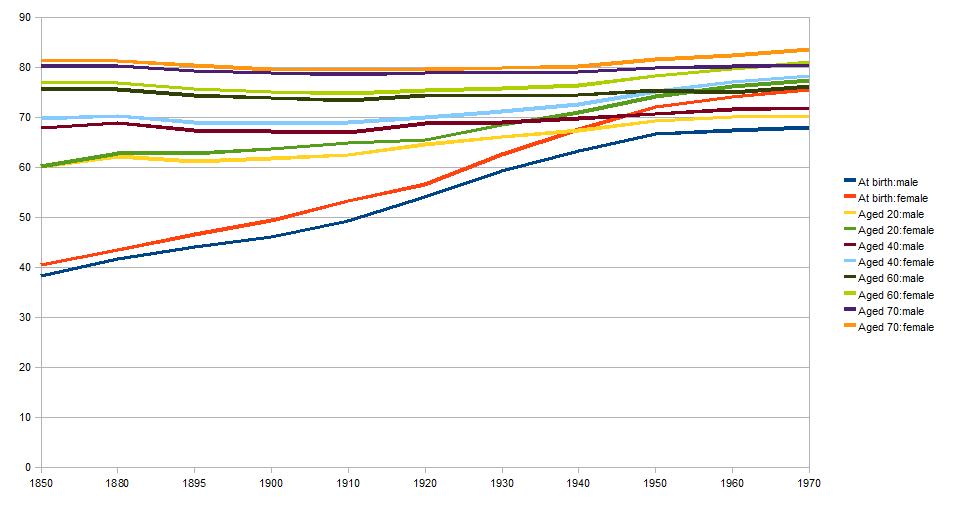
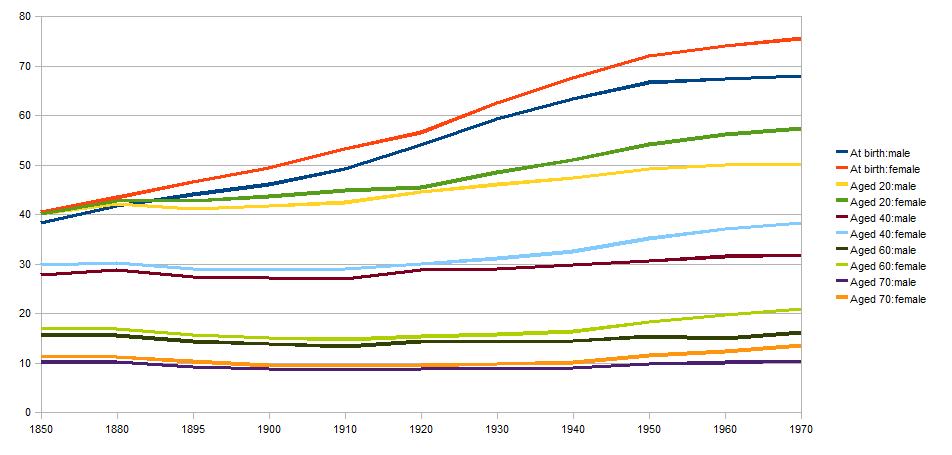
Expectation of Life at various Ages (Massachusetts 1850-1950 : US 1960 and 1970)

At birth:male At birth:female Aged 20:male Aged 20:female Aged 40:male Aged 40:female Aged 60:male Aged 60:female Aged 70:male Aged 70:female
1850 38.3 40.5 40.1 40.2 27.9 29.8 15.6 17 10.2 11.3
1880 41.7 43.5 42.2 42.8 28.9 30.3 15.6 16.9 10.3 11.3
1895 44.1 46.6 41.2 42.8 27.4 29 14.4 15.7 9.3 10.4
1900 46.1 49.4 41.8 43.7 27.2 28.8 13.9 15.1 8.9 9.6
1910 49.3 53.3 42.5 44.9 27 29 13.4 14.8 8.6 9.5
1920 54.1 56.6 44.6 45.5 28.8 30 14.4 15.4 8.9 9.6
1930 59.3 62.6 46.1 48.5 29 31.2 14.3 15.8 8.9 9.9
1940 63.3 67.6 47.4 51 29.8 32.6 14.5 16.4 9.1 10.2
1950 66.7 72.1 49.3 54.2 30.7 35.2 15.4 18.3 9.9 11.6
1960 67.4 74.1 50.1 56.2 31.6 37.1 15 19.7 10.2 12.4
1970 68 75.6 50.3 57.4 31.9 38.3 16.2 21 10.5 13.6


Table 1: Expectation of Life at various Ages (Massachusetts 1850-1950 : US 1960 and 1970)

Expected Age at Death at various Ages (Massachusetts 1850-1950 : US 1960 and 1970)

At birth:male At birth:female Aged 20:male Aged 20:female Aged 40:male Aged 40:female Aged 60:male Aged 60:female Aged 70:male Aged 70:female
1850 38.3 40.5 60.1 60.2 67.9 69.8 75.6 77 80.2 81.3
1880 41.7 43.5 62.2 62.8 68.9 70.3 75.6 76.9 80.3 81.3
1895 44.1 46.6 61.2 62.8 67.4 69 74.4 75.7 79.3 80.4
1900 46.1 49.4 61.8 63.7 67.2 68.8 73.9 75.1 78.9 79.6
1910 49.3 53.3 62.5 64.9 67 69 73.4 74.8 78.6 79.5
1920 54.1 56.6 64.6 65.5 68.8 70 74.4 75.4 78.9 79.6
1930 59.3 62.6 66.1 68.5 69 71.2 74.3 75.8 78.9 79.9
1940 63.3 67.6 67.4 71 69.8 72.6 74.5 76.4 79.1 80.2
1950 66.7 72.1 69.3 74.2 70.7 75.2 75.4 78.3 79.9 81.6
1960 67.4 74.1 70.1 76.2 71.6 77.1 75 79.7 80.2 82.4
1970 68 75.6 70.3 77.4 71.9 78.3 76.2 81 80.5 83.6


Table 2: Expected Age at Death at Various Ages (Massachusetts data 1850-1950 : US data 1960 and 1970)


2: Infectious Diseases in US (1900-1970)

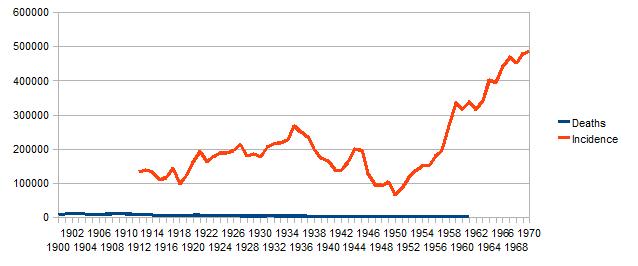
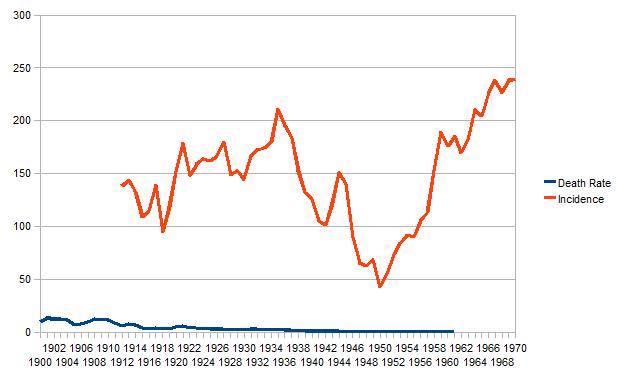
USA Deaths Rates and Incidence (1900-1970) DR=Death Rate (Deaths/100,000 population) I=Incidence (Cases per 100,000 population) FR=Fatality Rate (Deaths/Incidence)


Data taken from Historical Statistics of the United States Colonial Times to 1970 (http://www2.census.gov/prod2/statcomp/documents/CT1970p1-01.pdf)


Tuberc. DR Tuberc. I Tuberc. FR Syphilis DR Syphilis I Syphilis FR Typ/PTyp DR Typ/PTyp I Typ/PTyp FR Scar./ST DR Scar./ST I Scar./ST FR Diphtheria DR Diphtheria I Diphtheria FR Whoop DR Whoop I Whoop FR Measles DR Measles I Measles FR
1900 194.4

12

31.3

9.6

40.3

12.2

13.3

1901 189.9

12.5

17.6

13.6

33.6

8.7

7.4

1902 174.2

12.9

26.4

11.9

29.8

12.4

9.3

1903 177.2

13.2

24.6

12.3

31.1

14.3

8.8

1904 188.1

13.9

28.9

11.6

29.3

5.8

11.3

1905 179.9

13.8

22.4

6.8

23.5

8.9

7.4

1906 175.8

14.1

30.9

7.3

26.3

16.1

12.9

1907 174.2

12.4

28.2

9.3

24.2

11.3

9.6

1908 162.1

12.4

23.4

12.4

21.9

10.7

10.6

1909 156.3

12.9

20.2

11.1

19.9

10

10

1910 153.8

13.5

22.5

11.4

21.1

11.6

12.4

1911 155.1

15.3

20.1

8.6

18.4

11

9.9

1912 143.5

15.1

16.1 81.8 19.68% 6 138.2 4.34% 17.6 139 12.66% 9.2

7.2 310 2.32%
1913 145.4

16.2

17.5 84.2 20.78% 7.7 143.1 5.38% 18.1 142.1 12.74% 10.1

12.8 368.5 3.47%
1914 141.7

16.7

14.7 82.4 17.84% 6.6 133 4.96% 17.2 152.5 11.28% 10.2

6.8 295.8 2.30%
1915 140.1

17.7

31.8 74 42.97% 3.6 108.6 3.31% 15.2 132.7 11.45% 8.2

5.2 254.1 2.05%
1916 138.4

18.6

13.2 82.3 16.04% 3.1 114.5 2.71% 13.9 129.2 10.76% 10.5

11.4 621.8 1.83%
1917 143.5

19.1

13.3 63 21.11% 3.5 139.2 2.51% 15.6 133 11.73% 10.5

14.1 611.6 2.31%
1918 149.8

18.7

12.3 50 24.60% 3.1 94.5 3.28% 14 101.5 13.79% 17

10.8 474.9 2.27%
1919 125.6

16.2 113.2 14.31% 9.2 42.9 21.45% 2.8 118.3 2.37% 14.9 144.7 10.30% 5.6

3.9 203.2 1.92%
1920 113.1

16.5 145.3 11.36% 7.6 38.8 19.59% 4.6 151.6 3.03% 15.3 139 11.01% 12.5

8.8 480.5 1.83%
1921 97.6

17.5 172.3 10.16% 8.8 48.5 18.14% 5.3 178.7 2.97% 17.7 190.7 9.28% 9.1

4.2 274.5 1.53%
1922 95.8

18 157.7 11.41% 7.4 33 22.42% 3.5 148.1 2.36% 14.6 156.7 9.32% 5.5 97.7 5.63% 4.3 241.8 1.78%
1923 91.7

17.9 156.2 11.46% 6.7 31 21.61% 3.5 158.8 2.20% 12 131.4 9.13% 9.6 146.7 6.54% 10.7 680 1.57%
1924 87.9

17.8 174.2 10.22% 6.6 31 21.29% 3.1 164.2 1.89% 9.3 105.6 8.81% 8.1 145 5.59% 8.2 463.7 1.77%
1925 84.8

17.3 181.2 9.55% 7.8 40 19.50% 2.7 161.9 1.67% 7.8 82.1 9.50% 6.7 131.2 5.11% 2.3 194.3 1.18%
1926 85.5

17.1 196.1 8.72% 6.4 35.5 18.03% 2.5 166.7 1.50% 7.4 80.7 9.17% 8.8 172.2 5.11% 8.3 587.1 1.41%
1927 79.6

16.4 171.9 9.54% 5.3 29.2 18.15% 2.3 179.8 1.28% 7.7 89.8 8.57% 6.8 152.4 4.46% 4.1 387.6 1.06%
1928 78.3

16.4 174.2 9.41% 4.9 22.6 21.68% 1.9 148.9 1.28% 7.2 75.9 9.49% 5.4 134.3 4.02% 5.2 466.3 1.12%
1929 75.3

15.6 169.2 9.22% 4.2 19.1 21.99% 2.1 152.9 1.37% 6.5 70.1 9.27% 6.2 162.1 3.82% 2.5 300.6 0.83%
1930 71.1 101.5 70.05% 15.7 185.4 8.47% 4.8 22.1 21.72% 1.9 144.5 1.31% 4.9 54.1 9.06% 4.8 135.6 3.54% 3.2 340.8 0.94%
1931 67.8 100.7 67.33% 15.4 197.4 7.80% 4.5 21.4 21.03% 2.2 166.3 1.32% 4.8 57.1 8.41% 3.9 139.1 2.80% 3 382.8 0.78%
1932 62.5 97.7 63.97% 15.4 208.2 7.40% 3.7 21.4 17.29% 2.2 172.7 1.27% 4.4 48 9.17% 4.5 172.5 2.61% 1.6 323.2 0.50%
1933 59.6 91.1 65.42% 15.1 193.4 7.81% 3.6 18.6 19.35% 2 174.4 1.15% 3.9 40.2 9.70% 3.6 142.6 2.52% 2.2 319.2 0.69%
1934 56.7 89.4 63.42% 15.9 186.7 8.52% 3.4 17.6 19.32% 2 180 1.11% 3.3 34.1 9.68% 5.9 209.9 2.81% 5.5 682.6 0.81%
1935 55.1 87.9 62.68% 15.4 205.6 7.49% 2.8 14.4 19.44% 2.1 211 1.00% 3.1 30.8 10.06% 3.7 141.9 2.61% 3.1 584.6 0.53%
1936 55.9 83.6 66.87% 16.2 212.6 7.62% 2.5 12.4 20.16% 1.9 195.6 0.97% 2.4 23.4 10.26% 2.1 115 1.83% 1 234 0.43%
1937 58.8 87.2 67.43% 16.1 264.3 6.09% 2.1 12.4 16.94% 1.4 183.5 0.76% 2 22.2 9.01% 3.9 166.6 2.34% 1.2 249.6 0.48%
1938 49.1 82.4 59.59% 15.9 372 4.27% 1.9 11.5 16.52% 0.9 152.8 0.59% 2 23.5 8.51% 3.7 175.1 2.11% 2.5 633.8 0.39%
1939 47.1 79.4 59.32% 15 367.1 4.09% 1.5 10 15.00% 0.7 132.3 0.53% 1.5 18.4 8.15% 2.3 140 1.64% 0.9 308.2 0.29%
1940 46.9 78 60.13% 14.4 359.7 4.00% 1.1 7.4 14.86% 0.5 125.9 0.40% 1.1 11.8 9.32% 2.2 139.6 1.58% 0.5 220.7 0.23%
1941 44.5 79.3 56.12% 13.3 368.2 3.61% 0.8 6.5 12.31% 0.3 104.7 0.29% 1 13.5 7.41% 2.8 166.9 1.68% 1.7 671.7 0.25%
1942 43.1 87.5 49.26% 12.2 363.4 3.36% 0.6 4.6 13.04% 0.3 101.4 0.30% 1 12.1 8.26% 1.9 142.9 1.33% 1 408.8 0.24%
1943 42.1 89.6 46.99% 12.1 447 2.71% 0.5 4.1 12.20% 0.3 122 0.25% 0.9 11 8.18% 2.5 142.9 1.75% 1 472 0.21%
1944 41.1 95 43.26% 11.2 367.9 3.04% 0.4 4 10.00% 0.3 150.9 0.20% 0.9 10.6 8.49% 1.4 82.7 1.69% 1.4 474.3 0.30%
1945 39 86.8 44.93% 10.6 282.3 3.75% 0.4 3.7 10.81% 0.2 140.1 0.14% 1.2 14.1 8.51% 1.3 101 1.29% 0.2 110.2 0.18%
1946 36.4 85.2 42.72% 9.3 271.7 3.42% 0.3 2.8 10.71% 0.1 89.6 0.11% 0.9 11.7 7.69% 0.9 78.4 1.15% 0.9 496.8 0.18%
1947 33 94.1 35.07% 8.8 264.6 3.33% 0.2 2.8 7.14% 0.1 65.2 0.15% 0.6 8.5 7.06% 1.4 109.1 1.28% 0.8 155 0.52%
1948 30 93.8 31.98% 8 234.7 3.41% 0.2 2.5 8.00% 0 62.5 0.00% 0.4 6.5 6.15% 0.8 61.7 1.30% 0.6 421 0.14%
1949 26.8 90.7 29.55% 5.8 197.3 2.94% 0.1 2.7 3.70% 0.3 68.7 0.44% 0.4 5.4 7.41% 0.5 46.7 1.07% 0.6 420.6 0.14%
1950 22 80.4 27.36% 5 154.2 3.24% 0.1 1.6 6.25% 0.2 42.8 0.47% 0.3 8.8 3.41% 0.7 80.1 0.87% 0.9 210.1 0.43%
1951 20.1 77.3 26.00% 4.1 131.8 3.11% 0.1 1.4 7.14% 0.2 54.9 0.36% 0.2 2.6 7.69% 0.6 44.8 1.34% 0.4 345.6 0.12%
1952 15.8 70.5 22.41% 3.7 110.8 3.34% 0.1 1.5 6.67% 0.2 73 0.27% 0.1 1.9 5.26% 0.1 28.9 0.35% 0.4 438.5 0.09%
1953 12.3 53 23.21% 3.3 100.8 3.27%
1.4
0.1 84 0.12% 0.1 1.5 6.67% 0.2 23.5 0.85% 0.8 283.7 0.28%
1954 10.2 49.3 20.69% 3 87.5 3.43%
1.3
0.1 91.7 0.11% 0.1 1.3 7.69% 0.2 37.8 0.53% 0 423.5 0.00%
1955 9.3 46.9 19.83% 2.3 76 3.03%
1
0.1 89.8 0.11% 0.1 1.2 8.33% 0.1 38.2 0.26% 0.2 337.9 0.06%
1956 8.4 41.6 20.19% 2.3 77.1 2.98%
1
0.1 105.5 0.09% 0.1 0.9 11.11% 0.3 19 1.58%
365.9
1957 7.8 39.2 19.90% 2.2 78.3 2.81%
0.7
0.1 113.3 0.09%
0.7
0.1 16.6 0.60%
285.9
1958 7 36.5 19.18% 2 68.5 2.92%
0.6
0.1 152.4 0.07%
0.5
0.1 18.6 0.54%
440.5
1959 6.4 32.5 19.69% 1.7 69.3 2.45%
0.5
0.1 189.6 0.05%
0.5
0.2 22.7 0.88%
230.1
1960 6 30.8 19.48% 1.6 68 2.35%
0.5
0.1 175.8 0.06%
0.5
0.1 8.3 1.20%
245.4
1961 5 29.4 17.01% 1.6 69.7 2.30%
0.4
0.1 185 0.05%
0.3

6.3

231.6
1962 5 28.7 17.42% 1.5 68.1 2.20%
0.3

170

0.2

9.6

259
1963 4 28.7 13.94% 1.4 69.3 2.02%
0.3

181.6

0.2

9.1

204.2
1964 4 26.6 15.04% 1.4 62.9 2.23%
0.3

210.6

0.2

6.8

239.4
1965 4 25.3 15.81% 1.1 59.7 1.84%
0.2

204.3

0.1

3.5

135.1
1966 8 24.4 32.79% 1.1 57.1 1.93%
0.2

226.8

0.1

3.9

104.2
1967 3 23.1 12.99% 1.2 53.2 2.26%
0.2

238.1

0.1

4.9

31.7
1968 8 21.3 37.56% 0 49.9 0.00%
0.2

226.8

0.1

2.4

11.1
1969 2 19.4 10.31% 0.8 48.1 1.66%
0.2

238.2

0.1

1.6

12
1970 2 18.3 10.93% 0.2 43.8 0.46%
0.2

239.2

0.2

2.1

23.4


Where death rate data absent, either unavailable or less than 0.05 : where incidence data absent, unavailable : where fatality rate percentage absent, either or both death rate or incidence data unavailable or not precise.


TABLE 1. Incidence rate for infectious diseases in the US from 1900-1970 (where available) – data expressed as no. of confirmed cases/100,000 population


TABLE 2. Death rate for infectious diseases in the US from 1900-1970 (where available) – data expressed as no. of deaths/100,000 population


TABLE 3. Fatality rate for infectious diseases in the US from 1900-1970 (where available) – data expressed as no. of deaths/incidence


3: Infectious Disease Deaths in US (1900-1970)

Infectious Disease Deaths in US (1900-1970)


Total Deaths

Resident Population Tuberc. DR Tuberc. Deaths Syphilis DR Syphilis Deaths Typ/PTyp DR Typ/PTyp Deaths Scar./ST DR Scar./ST Deaths Diphtheria DR Diphtheria Deaths Whoop DR Whoop Deaths Measles DR Measles Deaths exclud. Syphilis percentage
1900 76094000 194.4 147927 12 9131 31.3 23817 9.6 7305 40.3 30666 12.2 9283 13.3 10121 229119 0.30%
1901 77584000 189.9 147332 12.5 9698 17.6 13655 13.6 10551 33.6 26068 8.7 6750 7.4 5741 210097 0.27%
1902 79163000 174.2 137902 12.9 10212 26.4 20899 11.9 9420 29.8 23591 12.4 9816 9.3 7362 208990 0.26%
1903 80632000 177.2 142880 13.2 10643 24.6 19835 12.3 9918 31.1 25077 14.3 11530 8.8 7096 216336 0.27%
1904 82266000 188.1 154742 13.9 11435 28.9 23775 11.6 9543 29.3 24104 5.8 4771 11.3 9296 226231 0.27%
1905 83822000 179.9 150796 13.8 11567 22.4 18776 6.8 5700 23.5 19698 8.9 7460 7.4 6203 208633 0.25%
1906 85450000 175.8 150221 14.1 12048 30.9 26404 7.3 6238 26.3 22473 16.1 13757 12.9 11023 230116 0.27%
1907 87008000 174.2 151568 12.4 10789 28.2 24536 9.3 8092 24.2 21056 11.3 9832 9.6 8353 223437 0.26%
1908 88710000 162.1 143799 12.4 11000 23.4 20758 12.4 11000 21.9 19427 10.7 9492 10.6 9403 213879 0.24%
1909 90490000 156.3 141436 12.9 11673 20.2 18279 11.1 10044 19.9 18008 10 9049 10 9049 205865 0.23%
1910 92407000 153.8 142122 13.5 12475 22.5 20792 11.4 10534 21.1 19498 11.6 10719 12.4 11458 215123 0.23%
1911 93863000 155.1 145582 15.3 14361 20.1 18866 8.6 8072 18.4 17271 11 10325 9.9 9292 209408 0.22%
1912 95335000 143.5 136806 15.1 14396 16.1 15349 6 5720 17.6 16779 9.2 8771 7.2 6864 190289 0.20%
1913 97225000 145.4 141365 16.2 15750 17.5 17014 7.7 7486 18.1 17598 10.1 9820 12.8 12445 205728 0.21%
1914 99111000 141.7 140440 16.7 16552 14.7 14569 6.6 6541 17.2 17047 10.2 10109 6.8 6740 195446 0.20%
1915 100546000 140.1 140865 17.7 17797 31.8 31974 3.6 3620 15.2 15283 8.2 8245 5.2 5228 205215 0.20%
1916 101961000 138.4 141114 18.6 18965 13.2 13459 3.1 3161 13.9 14173 10.5 10706 11.4 11624 194237 0.19%
1917 103268000 143.5 148190 19.1 19724 13.3 13735 3.5 3614 15.6 16110 10.5 10843 14.1 14561 207053 0.20%
1918 103208000 149.8 154606 18.7 19300 12.3 12695 3.1 3199 14 14449 17 17545 10.8 11146 213640 0.21%
1919 104514000 125.6 131270 16.2 16931 9.2 9615 2.8 2926 14.9 15573 5.6 5853 3.9 4076 169313 0.16%
1920 106461000 113.1 120407 16.5 17566 7.6 8091 4.6 4897 15.3 16289 12.5 13308 8.8 9369 172361 0.16%
1921 108538000 97.6 105933 17.5 18994 8.8 9551 5.3 5753 17.7 19211 9.1 9877 4.2 4559 154884 0.14%
1922 110049000 95.8 105427 18 19809 7.4 8144 3.5 3852 14.6 16067 5.5 6053 4.3 4732 144275 0.13%
1923 111947000 91.7 102655 17.9 20039 6.7 7500 3.5 3918 12 13434 9.6 10747 10.7 11978 150232 0.13%
1924 114109000 87.9 100302 17.8 20311 6.6 7531 3.1 3537 9.3 10612 8.1 9243 8.2 9357 140582 0.12%
1925 115829000 84.8 98223 17.3 20038 7.8 9035 2.7 3127 7.8 9035 6.7 7761 2.3 2664 129845 0.11%
1926 117397000 85.5 100374 17.1 20075 6.4 7513 2.5 2935 7.4 8687 8.8 10331 8.3 9744 139584 0.12%
1927 119035000 79.6 94752 16.4 19522 5.3 6309 2.3 2738 7.7 9166 6.8 8094 4.1 4880 125939 0.11%
1928 120509000 78.3 94359 16.4 19763 4.9 5905 1.9 2290 7.2 8677 5.4 6507 5.2 6266 124004 0.10%
1929 121767000 75.3 91691 15.6 18996 4.2 5114 2.1 2557 6.5 7915 6.2 7550 2.5 3044 117871 0.10%
1930 123077000 71.1 87508 15.7 19323 4.8 5908 1.9 2338 4.9 6031 4.8 5908 3.2 3938 111631 0.09%
1931 124040000 67.8 84099 15.4 19102 4.5 5582 2.2 2729 4.8 5954 3.9 4838 3 3721 106923 0.09%
1932 124840000 62.5 78025 15.4 19225 3.7 4619 2.2 2746 4.4 5493 4.5 5618 1.6 1997 98498 0.08%
1933 125579000 59.6 74845 15.1 18962 3.6 4521 2 2512 3.9 4898 3.6 4521 2.2 2763 94060 0.07%
1934 126374000 56.7 71654 15.9 20093 3.4 4297 2 2527 3.3 4170 5.9 7456 5.5 6951 97055 0.08%
1935 127250000 55.1 70115 15.4 19597 2.8 3563 2.1 2672 3.1 3945 3.7 4708 3.1 3945 88948 0.07%
1936 128053000 55.9 71582 16.2 20745 2.5 3201 1.9 2433 2.4 3073 2.1 2689 1 1281 84259 0.07%
1937 128825000 58.8 75749 16.1 20741 2.1 2705 1.4 1804 2 2577 3.9 5024 1.2 1546 89405 0.07%
1938 129825000 49.1 63744 15.9 20642 1.9 2467 0.9 1168 2 2597 3.7 4804 2.5 3246 78026 0.06%
1939 130880000 47.1 61644 15 19632 1.5 1963 0.7 916 1.5 1963 2.3 3010 0.9 1178 70674 0.05%
1940 131954000 46.9 61886 14.4 19001 1.1 1451 0.5 660 1.1 1451 2.2 2903 0.5 660 69011 0.05%
1941 133121000 44.5 59239 13.3 17705 0.8 1065 0.3 399 1 1331 2.8 3727 1.7 2263 68024 0.05%
1942 134245000 43.1 57860 12.2 16378 0.6 805 0.3 403 1 1342 1.9 2551 1 1342 64303 0.05%
1943 132885000 42.1 55945 12.1 16079 0.5 664 0.3 399 0.9 1196 2.5 3322 1 1329 62855 0.05%
1944 132481000 41.1 54450 11.2 14838 0.4 530 0.3 397 0.9 1192 1.4 1855 1.4 1855 60279 0.05%
1945 140054000 39 54621 10.6 14846 0.4 560 0.2 280 1.2 1681 1.3 1821 0.2 280 59243 0.04%
1946 143446000 36.4 52214 9.3 13340 0.3 430 0.1 143 0.9 1291 0.9 1291 0.9 1291 56660 0.04%
1947 146093000 33 48211 8.8 12856 0.2 292 0.1 146 0.6 877 1.4 2045 0.8 1169 52740 0.04%
1948 148665000 30 44600 8 11893 0.2 297 0 0 0.4 595 0.8 1189 0.6 892 47573 0.03%
1949 151235000 26.8 40531 5.8 8772 0.1 151 0.3 454 0.4 605 0.5 756 0.6 907 43404 0.03%
1950 153310000 22 33728 5 7666 0.1 153 0.2 307 0.3 460 0.7 1073 0.9 1380 37101 0.02%
1951 155687000 20.1 31293 4.1 6383 0.1 156 0.2 311 0.2 311 0.6 934 0.4 623 33628 0.02%
1952 158242000 15.8 25002 3.7 5855 0.1 158 0.2 316 0.1 158 0.1 158 0.4 633 26425 0.02%
1953 161164000 12.3 19823 3.3 5318

0.1 161 0.1 161 0.2 322 0.8 1289 21756 0.01%
1954 164308000 10.2 16759 3 4929

0.1 164 0.1 164 0.2 329 0 0 17416 0.01%
1955 167306000 9.3 15559 2.3 3848

0.1 167 0.1 167 0.1 167 0.2 335 16395 0.01%
1956 170371000 8.4 14311 2.3 3919

0.1 170 0.1 170 0.3 511

15162 0.01%
1957 173320000 7.8 13519 2.2 3813

0.1 173

0.1 173

13865 0.01%
1958 176289000 7 12340 2 3526

0.1 176

0.1 176

12692 0.01%
1959 177135000 6.4 11337 1.7 3011

0.1 177

0.2 354

11868 0.01%
1960 179979000 6 10799 1.6 2880

0.1 180

0.1 180

11159 0.01%
1961 182992000 5 9150 1.6 2928

0.1 183


9333 0.01%
1962 185771000 5 9289 1.5 2787


9289 0.01%
1963 188483000 4 7539 1.4 2639


7539 0.00%
1964 191141000 4 7646 1.4 2676


7646 0.00%
1965 193526000 4 7741 1.1 2129


7741 0.00%
1966 195576000 8 15646 1.1 2151


15646 0.01%
1967 197457000 3 5924 1.2 2369


5924 0.00%
1968 199399000 8 15952 0 0


15952 0.01%
1969 201385000 2 4028 0.8 1611


4028 0.00%
1970 203810000 2 4076 0.2 408


4076 0.00%


TABLE I. Deaths from infectious diseases in the US from 1900-1970 (where available) – data expressed as no. of deaths


4: Infectious Disease Incidence in US (1900-1970)

Infectious Disease Incidence in US (1900-1970)


Res. Population Tuberc. IR Tuberc. Inc Syphilis IR Syphilis Inc. Typ/PTyp IR Typ/PTyp Inc. Scar./ST IR Scar./ST Inc. Diphtheria IR Diphtheria Inc. Whoop IR Whoop Inc. Measles IR Measles Inc.
1900 76094000


1901 77584000


1902 79163000


1903 80632000


1904 82266000


1905 83822000


1906 85450000


1907 87008000


1908 88710000


1909 90490000


1910 92407000


1911 93863000


1912 95335000


81.8 77984 138.2 131753 139 132516

310 295539
1913 97225000


84.2 81863 143.1 139129 142.1 138157

368.5 358274
1914 99111000


82.4 81667 133 131818 152.5 151144

295.8 293170
1915 100546000


74 74404 108.6 109193 132.7 133425

254.1 255487
1916 101961000


82.3 83914 114.5 116745 129.2 131734

621.8 633993
1917 103268000


63 65059 139.2 143749 133 137346

611.6 631587
1918 103208000


50 51604 94.5 97532 101.5 104756

474.9 490135
1919 104514000

113.2 118310 42.9 44837 118.3 123640 144.7 151232

203.2 212372
1920 106461000

145.3 154688 38.8 41307 151.6 161395 139 147981

480.5 511545
1921 108538000

172.3 187011 48.5 52641 178.7 193957 190.7 206982

274.5 297937
1922 110049000

157.7 173547 33 36316 148.1 162983 156.7 172447 97.7 107518 241.8 266098
1923 111947000

156.2 174861 31 34704 158.8 177772 131.4 147098 146.7 164226 680 761240
1924 114109000

174.2 198778 31 35374 164.2 187367 105.6 120499 145 165458 463.7 529123
1925 115829000

181.2 209882 40 46332 161.9 187527 82.1 95096 131.2 151968 194.3 225056
1926 117397000

196.1 230216 35.5 41676 166.7 195701 80.7 94739 172.2 202158 587.1 689238
1927 119035000

171.9 204621 29.2 34758 179.8 214025 89.8 106893 152.4 181409 387.6 461380
1928 120509000

174.2 209927 22.6 27235 148.9 179438 75.9 91466 134.3 161844 466.3 561933
1929 121767000

169.2 206030 19.1 23257 152.9 186182 70.1 85359 162.1 197384 300.6 366032
1930 123077000 101.5 124923 185.4 228185 22.1 27200 144.5 177846 54.1 66585 135.6 166892 340.8 419446
1931 124040000 100.7 124908 197.4 244855 21.4 26545 166.3 206279 57.1 70827 139.1 172540 382.8 474825
1932 124840000 97.7 121969 208.2 259917 21.4 26716 172.7 215599 48 59923 172.5 215349 323.2 403483
1933 125579000 91.1 114402 193.4 242870 18.6 23358 174.4 219010 40.2 50483 142.6 179076 319.2 400848
1934 126374000 89.4 112978 186.7 235940 17.6 22242 180 227473 34.1 43094 209.9 265259 682.6 862629
1935 127250000 87.9 111853 205.6 261626 14.4 18324 211 268498 30.8 39193 141.9 180568 584.6 743904
1936 128053000 83.6 107052 212.6 272241 12.4 15879 195.6 250472 23.4 29964 115 147261 234 299644
1937 128825000 87.2 112335 264.3 340484 12.4 15974 183.5 236394 22.2 28599 166.6 214622 249.6 321547
1938 129825000 82.4 106976 372 482949 11.5 14930 152.8 198373 23.5 30509 175.1 227324 633.8 822831
1939 130880000 79.4 103919 367.1 480460 10 13088 132.3 173154 18.4 24082 140 183232 308.2 403372
1940 131954000 78 102924 359.7 474639 7.4 9765 125.9 166130 11.8 15571 139.6 184208 220.7 291222
1941 133121000 79.3 105565 368.2 490152 6.5 8653 104.7 139378 13.5 17971 166.9 222179 671.7 894174
1942 134245000 87.5 117464 363.4 487846 4.6 6175 101.4 136124 12.1 16244 142.9 191836 408.8 548794
1943 132885000 89.6 119065 447 593996 4.1 5448 122 162120 11 14617 142.9 189893 472 627217
1944 132481000 95 125857 367.9 487398 4 5299 150.9 199914 10.6 14043 82.7 109562 474.3 628357
1945 140054000 86.8 121567 282.3 395372 3.7 5182 140.1 196216 14.1 19748 101 141455 110.2 154340
1946 143446000 85.2 122216 271.7 389743 2.8 4016 89.6 128528 11.7 16783 78.4 112462 496.8 712640
1947 146093000 94.1 137474 264.6 386562 2.8 4091 65.2 95253 8.5 12418 109.1 159387 155 226444
1948 148665000 93.8 139448 234.7 348917 2.5 3717 62.5 92916 6.5 9663 61.7 91726 421 625880
1949 151235000 90.7 137170 197.3 298387 2.7 4083 68.7 103898 5.4 8167 46.7 70627 420.6 636094
1950 153310000 80.4 123261 154.2 236404 1.6 2453 42.8 65617 8.8 13491 80.1 122801 210.1 322104
1951 155687000 77.3 120346 131.8 205195 1.4 2180 54.9 85472 2.6 4048 44.8 69748 345.6 538054
1952 158242000 70.5 111561 110.8 175332 1.5 2374 73 115517 1.9 3007 28.9 45732 438.5 693891
1953 161164000 53 85417 100.8 162453 1.4
84 135378 1.5 2417 23.5 37874 283.7 457222
1954 164308000 49.3 81004 87.5 143770 1.3
91.7 150670 1.3 2136 37.8 62108 423.5 695844
1955 167306000 46.9 78467 76 127153 1
89.8 150241 1.2 2008 38.2 63911 337.9 565327
1956 170371000 41.6 70874 77.1 131356 1
105.5 179741 0.9 1533 19 32370 365.9

1957 173320000 39.2 67941 78.3 135710 0.7
113.3 196372 0.7
16.6 28771 285.9

1958 176289000 36.5 64345 68.5 120758 0.6
152.4 268664 0.5
18.6 32790 440.5

1959 177135000 32.5 57569 69.3 122755 0.5
189.6 335848 0.5
22.7 40210 230.1

1960 179979000 30.8 55434 68 122386 0.5
175.8 316403 0.5
8.3 14938 245.4

1961 182992000 29.4 53800 69.7 127545 0.4
185 338535 0.3
6.3
231.6

1962 185771000 28.7 53316 68.1 126510 0.3
170
0.2
9.6
259

1963 188483000 28.7 54095 69.3 130619 0.3
181.6
0.2
9.1
204.2

1964 191141000 26.6 50844 62.9 120228 0.3
210.6
0.2
6.8
239.4

1965 193526000 25.3 48962 59.7 115535 0.2
204.3
0.1
3.5
135.1

1966 195576000 24.4 47721 57.1 111674 0.2
226.8
0.1
3.9
104.2

1967 197457000 23.1 45613 53.2 105047 0.2
238.1
0.1
4.9
31.7

1968 199399000 21.3 42472 49.9 99500 0.2
226.8
0.1
2.4
11.1

1969 201385000 19.4 39069 48.1 96866 0.2
238.2
0.1
1.6
12

1970 203810000 18.3 37297 43.8 89269 0.2
239.2
0.2
2.1
23.4


TABLE 1. Incidence of infectious diseases in the US from 1900-1970 (where available) – data expressed as no. of confirmed cases


5: Tuberculosis in US (1900-1970)

Deaths Rates and Incidence in US (1900-1970)


Tuberculosis


Death Rate Incidence Fatality Rate Res Pop Deaths Incidence
1900 194.4

76094000 147927
1901 189.9

77584000 147332
1902 174.2

79163000 137902
1903 177.2

80632000 142880
1904 188.1

82266000 154742
1905 179.9

83822000 150796
1906 175.8

85450000 150221
1907 174.2

87008000 151568
1908 162.1

88710000 143799
1909 156.3

90490000 141436
1910 153.8

92407000 142122
1911 155.1

93863000 145582
1912 143.5

95335000 136806
1913 145.4

97225000 141365
1914 141.7

99111000 140440
1915 140.1

100546000 140865
1916 138.4

101961000 141114
1917 143.5

103268000 148190
1918 149.8

103208000 154606
1919 125.6

104514000 131270
1920 113.1

106461000 120407
1921 97.6

108538000 105933
1922 95.8

110049000 105427
1923 91.7

111947000 102655
1924 87.9

114109000 100302
1925 84.8

115829000 98223

TABLE 1. Death rate and incidence for tuberculosis in the US from 1900-1970 (where available)
1926 85.5

117397000 100374

(data expressed as per 100,000 of population)


1927 79.6

119035000 94752


1928 78.3

120509000 94359


1929 75.3

121767000 91691

1930 71.1 101.5 0.7 123077000 87508 124923
1931 67.8 100.7 0.67 124040000 84099 124908
1932 62.5 97.7 0.64 124840000 78025 121969
1933 59.6 91.1 0.65 125579000 74845 114402
1934 56.7 89.4 0.63 126374000 71654 112978
1935 55.1 87.9 0.63 127250000 70115 111853
1936 55.9 83.6 0.67 128053000 71582 107052
1937 58.8 87.2 0.67 128825000 75749 112335
1938 49.1 82.4 0.6 129825000 63744 106976
1939 47.1 79.4 0.59 130880000 61644 103919
1940 46.9 78 0.6 131954000 61886 102924
1941 44.5 79.3 0.56 133121000 59239 105565
1942 43.1 87.5 0.49 134245000 57860 117464
1943 42.1 89.6 0.47 132885000 55945 119065
1944 41.1 95 0.43 132481000 54450 125857
1945 39 86.8 0.45 140054000 54621 121567
1946 36.4 85.2 0.43 143446000 52214 122216
1947 33 94.1 0.35 146093000 48211 137474
1948 30 93.8 0.32 148665000 44600 139448
1949 26.8 90.7 0.3 151235000 40531 137170
1950 22 80.4 0.27 153310000 33728 123261
1951 20.1 77.3 0.26 155687000 31293 120346
1952 15.8 70.5 0.22 158242000 25002 111561
1953 12.3 53 0.23 161164000 19823 85417
1954 10.2 49.3 0.21 164308000 16759 81004
1955 9.3 46.9 0.2 167306000 15559 78467
1956 8.4 41.6 0.2 170371000 14311 70874
1957 7.8 39.2 0.2 173320000 13519 67941
1958 7 36.5 0.19 176289000 12340 64345
TABLE 2. Deaths and incidence for tuberculosis in the US from 1900-1970 (where available)

1959 6.4 32.5 0.2 177135000 11337 57569


1960 6 30.8 0.19 179979000 10799 55434


1961 5 29.4 0.17 182992000 9150 53800


1962 5 28.7 0.17 185771000 9289 53316


1963 4 28.7 0.14 188483000 7539 54095


1964 4 26.6 0.15 191141000 7646 50844


1965 4 25.3 0.16 193526000 7741 48962


1966 8 24.4 0.33 195576000 15646 47721


1967 3 23.1 0.13 197457000 5924 45613


1968 8 21.3 0.38 199399000 15952 42472


1969 2 19.4 0.1 201385000 4028 39069


1970 2 18.3 0.11 203810000 4076 37297


Wikipedia (http://en.wikipedia.org/wiki/Tuberculosis) (http://en.wikipedia.org/wiki/Bacillus_Calmette-Gu%C3%A9rin)


Tuberculosis (TB) has co-evolved with humans for many thousands of years, and perhaps for several million years. The oldest known human remains showing signs of tuberculosis infection are 9,000 years old. TB is spread through the air, when people who have the disease cough, sneeze, or spit. Most infections in human beings will result in asymptomatic, latent infection, and about one in ten latent infections will eventually progress to active disease, which, if left untreated, kills more than half of its victims. Transmission can only occur from people with active - not latent- TB.

Mass vaccination with BCG did not start until after World War II. The protective efficacy of BCG for preventing serious forms of TB (e.g. meningitis) in children is greater than 80%; its protective efficacy for preventing pulmonary TB in adolescents and adults is variable, ranging from 0 to 80%.


The US has never used mass immunization of BCG, relying instead on the detection and treatment of latent tuberculosis. From 1946, the development of the antibiotic streptomycin offered an effective treatment and cure became possible.


BCG provides some protection against severe forms of paediatric TB, but has been shown to be unreliable against adult pulmonary TB, which accounts for most of the disease burden worldwide. Currently, there are more cases of TB on the planet than at any other time in history and most agree there is an urgent need for a newer, more effective vaccine that would prevent all forms of TB—including drug resistant strains—in all age groups and among people with HIV.


6: Syphilis in US (1900-1970)

Deaths Rates and Incidence in US (1900-1970)


Syphilis


Death Rate Incidence Fatality Rate Resident Pop Deaths Incidence
1900 12

76094000 9131
1901 12.5

77584000 9698
1902 12.9

79163000 10212
1903 13.2

80632000 10643
1904 13.9

82266000 11435
1905 13.8

83822000 11567
1906 14.1

85450000 12048
1907 12.4

87008000 10789
1908 12.4

88710000 11000
1909 12.9

90490000 11673
1910 13.5

92407000 12475
1911 15.3

93863000 14361
1912 15.1

95335000 14396
1913 16.2

97225000 15750
1914 16.7

99111000 16552
1915 17.7

100546000 17797
1916 18.6

101961000 18965
1917 19.1

103268000 19724
1918 18.7

103208000 19300
1919 16.2 113.2 0.14 104514000 16931 118310
1920 16.5 145.3 0.11 106461000 17566 154688
1921 17.5 172.3 0.1 108538000 18994 187011


1922 18 157.7 0.11 110049000 19809 173547
TABLE 1. Death rate and incidence for syphilis in the US from 1900-1970 (where available)
1923 17.9 156.2 0.11 111947000 20039 174861
(data expressed as per 100,000 of population)


1924 17.8 174.2 0.1 114109000 20311 198778


1925 17.3 181.2 0.1 115829000 20038 209882
1926 17.1 196.1 0.09 117397000 20075 230216
1927 16.4 171.9 0.1 119035000 19522 204621
1928 16.4 174.2 0.09 120509000 19763 209927
1929 15.6 169.2 0.09 121767000 18996 206030
1930 15.7 185.4 0.08 123077000 19323 228185
1931 15.4 197.4 0.08 124040000 19102 244855
1932 15.4 208.2 0.07 124840000 19225 259917
1933 15.1 193.4 0.08 125579000 18962 242870
1934 15.9 186.7 0.09 126374000 20093 235940
1935 15.4 205.6 0.07 127250000 19597 261626
1936 16.2 212.6 0.08 128053000 20745 272241
1937 16.1 264.3 0.06 128825000 20741 340484
1938 15.9 372 0.04 129825000 20642 482949
1939 15 367.1 0.04 130880000 19632 480460
1940 14.4 359.7 0.04 131954000 19001 474639
1941 13.3 368.2 0.04 133121000 17705 490152
1942 12.2 363.4 0.03 134245000 16378 487846
1943 12.1 447 0.03 132885000 16079 593996
1944 11.2 367.9 0.03 132481000 14838 487398
1945 10.6 282.3 0.04 140054000 14846 395372
1946 9.3 271.7 0.03 143446000 13340 389743
1947 8.8 264.6 0.03 146093000 12856 386562
1948 8 234.7 0.03 148665000 11893 348917
1949 5.8 197.3 0.03 151235000 8772 298387
1950 5 154.2 0.03 153310000 7666 236404
TABLE 2. Deaths and incidence for syphilis in the US from 1900-1970 (where available)
1951 4.1 131.8 0.03 155687000 6383 205195


1952 3.7 110.8 0.03 158242000 5855 175332


1953 3.3 100.8 0.03 161164000 5318 162453


1954 3 87.5 0.03 164308000 4929 143770


1955 2.3 76 0.03 167306000 3848 127153


1956 2.3 77.1 0.03 170371000 3919 131356


1957 2.2 78.3 0.03 173320000 3813 135710


1958 2 68.5 0.03 176289000 3526 120758


1959 1.7 69.3 0.02 177135000 3011 122755


1960 1.6 68 0.02 179979000 2880 122386


1961 1.6 69.7 0.02 182992000 2928 127545


1962 1.5 68.1 0.02 185771000 2787 126510


1963 1.4 69.3 0.02 188483000 2639 130619


1964 1.4 62.9 0.02 191141000 2676 120228


1965 1.1 59.7 0.02 193526000 2129 115535


1966 1.1 57.1 0.02 195576000 2151 111674


1967 1.2 53.2 0.02 197457000 2369 105047


1968 0 49.9 0 199399000 0 99500


1969 0.8 48.1 0.02 201385000 1611 96866


1970 0.2 43.8 0 203810000 408 89269


Wikipedia (http://en.wikipedia.org/wiki/Syphilis)


As the disease became better understood, more effective treatments were found. The first antibiotic to be used for treating disease was the arsenic-containing drug Salvarsan, developed in 1908 by Sahachiro Hata while working in the laboratory of Nobel prize winner Paul Ehrlich. This was later modified into Neosalvarsan. Unfortunately, these drugs were not 100% effective, especially in late disease. It had been observed that some who develop high fevers could be cured of syphilis. Thus, for a brief time maleria was used as treatment for tertiary syphilis because it produced prolonged and high fevers (a form of pyrotherapy). This was considered an acceptable risk because the malaria could later be treated with quinine which was available at that time. This discovery was championed by Julius Wagner-Jauregg, who won the 1927 Nobel Prize for Medicine for his work in this area. Malaria as a treatment for syphilis was usually reserved for late disease, especially neurosyphilis, and then followed by either Salvarsan or Neosalvarsan as adjuvant therapy. These treatments were finally rendered obsolete by the discovery of penicillin, and its widespread manufacture after World War II allowed syphilis to be effectively and reliably cured.


7: Typhoid & Paratyphoid in US (1900-1970)

Deaths Rates and Incidence in US (1900-1970)


Typhoid/Paratyphoid


Death Rate Incidence Fatality Rate Resident Pop Deaths Incidence
1900 31.3

76094000 23817
1901 17.6

77584000 13655
1902 26.4

79163000 20899
1903 24.6

80632000 19835
1904 28.9

82266000 23775
1905 22.4

83822000 18776
1906 30.9

85450000 26404
1907 28.2

87008000 24536
1908 23.4

88710000 20758
1909 20.2

90490000 18279
1910 22.5

92407000 20792
1911 20.1

93863000 18866
1912 16.1 81.8 0.2 95335000 15349 77984
1913 17.5 84.2 0.21 97225000 17014 81863
1914 14.7 82.4 0.18 99111000 14569 81667
1915 31.8 74 0.43 100546000 31974 74404
1916 13.2 82.3 0.16 101961000 13459 83914
1917 13.3 63 0.21 103268000 13735 65059
1918 12.3 50 0.25 103208000 12695 51604
1919 9.2 42.9 0.21 104514000 9615 44837
1920 7.6 38.8 0.2 106461000 8091 41307
1921 8.8 48.5 0.18 108538000 9551 52641
1922 7.4 33 0.22 110049000 8144 36316
1923 6.7 31 0.22 111947000 7500 34704
TABLE 1. Death rate and incidence for typhoid & paratyphoid in the US from 1900-1970 (where available)
1924 6.6 31 0.21 114109000 7531 35374
(data expressed as per 100,000 of population)


1925 7.8 40 0.2 115829000 9035 46332


1926 6.4 35.5 0.18 117397000 7513 41676
1927 5.3 29.2 0.18 119035000 6309 34758
1928 4.9 22.6 0.22 120509000 5905 27235
1929 4.2 19.1 0.22 121767000 5114 23257
1930 4.8 22.1 0.22 123077000 5908 27200
1931 4.5 21.4 0.21 124040000 5582 26545
1932 3.7 21.4 0.17 124840000 4619 26716
1933 3.6 18.6 0.19 125579000 4521 23358
1934 3.4 17.6 0.19 126374000 4297 22242
1935 2.8 14.4 0.19 127250000 3563 18324
1936 2.5 12.4 0.2 128053000 3201 15879
1937 2.1 12.4 0.17 128825000 2705 15974
1938 1.9 11.5 0.17 129825000 2467 14930
1939 1.5 10 0.15 130880000 1963 13088
1940 1.1 7.4 0.15 131954000 1451 9765
1941 0.8 6.5 0.12 133121000 1065 8653
1942 0.6 4.6 0.13 134245000 805 6175
1943 0.5 4.1 0.12 132885000 664 5448
1944 0.4 4 0.1 132481000 530 5299
1945 0.4 3.7 0.11 140054000 560 5182
1946 0.3 2.8 0.11 143446000 430 4016
1947 0.2 2.8 0.07 146093000 292 4091
1948 0.2 2.5 0.08 148665000 297 3717
1949 0.1 2.7 0.04 151235000 151 4083
TABLE 2. Deaths and incidence for typhoid & paratyphoid in the US from 1900-1970 (where available)
1950 0.1 1.6 0.06 153310000 153 2453


1951 0.1 1.4 0.07 155687000 156 2180


1952 0.1 1.5 0.07 158242000 158 2374


1953
1.4
161164000
2256


1954
1.3
164308000
2136


1955
1
167306000
1673


1956
1
170371000
1704


1957
0.7
173320000
1213


1958
0.6
176289000
1058


1959
0.5
177135000
886


1960
0.5
179979000
900


1961
0.4
182992000
732


1962
0.3
185771000
557


1963
0.3
188483000
565


1964
0.3
191141000
573


1965
0.2
193526000
387


1966
0.2
195576000
391


1967
0.2
197457000
395


1968
0.2
199399000
399


1969
0.2
201385000
403


1970
0.2
203810000
408


data less than 0.05 is entered as 0 from 1953


Wikipedia (http://en.wikipedia.org/wiki/Typhoid_fever)


Sanitation and hygiene are the critical measures that can be taken to prevent typhoid. Typhoid does not affect animals and therefore transmission is only from human to human. Typhoid can only spread in environments where human faeces or urine are able to come into contact with food or drinking water. Careful food preparation and washing of hands are therefore crucial to preventing typhoid.


According to statistics from the United States Center for Disease Control, the chlorination of drinking water has led to dramatic decreases in the transmission of typhoid fever in the U.S.


8: Scarlet Fever & Strep. Throat in US (1900-1970)

Deaths Rates and Incidence in US (1900-1970)


Scarlet Fever/Strep Throat Note: strep throat included from 1920 onwards


Death Rate Incidence Fatality Rate Resident Pop Deaths Incidence


1900 9.6

76094000 7305


1901 13.6

77584000 10551


1902 11.9

79163000 9420


1903 12.3

80632000 9918


1904 11.6

82266000 9543


1905 6.8

83822000 5700


1906 7.3

85450000 6238


1907 9.3

87008000 8092


1908 12.4

88710000 11000


1909 11.1

90490000 10044


1910 11.4

92407000 10534


1911 8.6

93863000 8072


1912 6 138.2 0.04 95335000 5720 131753


1913 7.7 143.1 0.05 97225000 7486 139129


1914 6.6 133 0.05 99111000 6541 131818


1915 3.6 108.6 0.03 100546000 3620 109193


1916 3.1 114.5 0.03 101961000 3161 116745


1917 3.5 139.2 0.03 103268000 3614 143749


1918 3.1 94.5 0.03 103208000 3199 97532


1919 2.8 118.3 0.02 104514000 2926 123640


1920 4.6 151.6 0.03 106461000 4897 161395


1921 5.3 178.7 0.03 108538000 5753 193957


1922 3.5 148.1 0.02 110049000 3852 162983
TABLE 1. Death rate and incidence for scarlet fever and strep throat in the US from 1900-1970 (where available)
1923 3.5 158.8 0.02 111947000 3918 177772
(data expressed as per 100,000 of population)


1924 3.1 164.2 0.02 114109000 3537 187367


1925 2.7 161.9 0.02 115829000 3127 187527
1926 2.5 166.7 0.01 117397000 2935 195701
1927 2.3 179.8 0.01 119035000 2738 214025
1928 1.9 148.9 0.01 120509000 2290 179438
1929 2.1 152.9 0.01 121767000 2557 186182
1930 1.9 144.5 0.01 123077000 2338 177846
1931 2.2 166.3 0.01 124040000 2729 206279
1932 2.2 172.7 0.01 124840000 2746 215599
1933 2 174.4 0.01 125579000 2512 219010
1934 2 180 0.01 126374000 2527 227473
1935 2.1 211 0.01 127250000 2672 268498
1936 1.9 195.6 0.01 128053000 2433 250472
1937 1.4 183.5 0.01 128825000 1804 236394
1938 0.9 152.8 0.01 129825000 1168 198373
1939 0.7 132.3 0.01 130880000 916 173154
1940 0.5 125.9 0 131954000 660 166130
1941 0.3 104.7 0 133121000 399 139378


1942 0.3 101.4 0 134245000 403 136124
TABLE 2. Deaths and incidence for scarlet fever and strep throat in the US from 1900-1970 (where available)
1943 0.3 122 0 132885000 399 162120


1944 0.3 150.9 0 132481000 397 199914


1945 0.2 140.1 0 140054000 280 196216


1946 0.1 89.6 0 143446000 143 128528


1947 0.1 65.2 0 146093000 146 95253


1948 0 62.5 0 148665000 0 92916


1949 0.3 68.7 0 151235000 454 103898


1950 0.2 42.8 0 153310000 307 65617


1951 0.2 54.9 0 155687000 311 85472


1952 0.2 73 0 158242000 316 115517


1953 0.1 84 0 161164000 161 135378


1954 0.1 91.7 0 164308000 164 150670


1955 0.1 89.8 0 167306000 167 150241


1956 0.1 105.5 0 170371000 170 179741


1957 0.1 113.3 0 173320000 173 196372


1958 0.1 152.4 0 176289000 176 268664


1959 0.1 189.6 0 177135000 177 335848


1960 0.1 175.8 0 179979000 180 316403


1961 0.1 185 0 182992000 183 338535


1962
170
185771000
315811


1963
181.6
188483000
342285


1964
210.6
191141000
402543


1965
204.3
193526000
395374


1966
226.8
195576000
443566


1967
238.1
197457000
470145


1968
226.8
199399000
452237


1969
238.2
201385000
479699


1970
239.2
203810000
487514


data less than 0.05 entered a 0 from 1962


Wikipedia (http://en.wikipedia.org/wiki/Scarlet_fever)


Husband and wife Gladys Henry Dick and George Frederick Dick developed a vaccine in the 1920s that was later eclipsed by penicillin in the 1940s. Other than the occurrence of the diarrhoea, the treatment and course of scarlet fever are no different from those of any strep throat. In case of penicillin allergy, clindamycin or erythromycin can be used with success. Patients should no longer be infectious after taking antibiotics for 24 hours. Persons who have been exposed to scarlet fever should watch carefully for a full week for symptoms, especially if aged 3 to young adult. It's very important to be tested (throat culture) and if positive, seek treatment. For reasons unknown, toddlers rarely contract scarlet fever.


9: Diphtheria in US (1900-1970)

Deaths Rates and Incidence in US (1900-1970)


Diphtheria


Death Rate Incidence Fatality Rate Resident Pop Deaths Incidence
1900 40.3

76094000 30666
1901 33.6

77584000 26068
1902 29.8

79163000 23591
1903 31.1

80632000 25077
1904 29.3

82266000 24104
1905 23.5

83822000 19698
1906 26.3

85450000 22473
1907 24.2

87008000 21056
1908 21.9

88710000 19427
1909 19.9

90490000 18008
1910 21.1

92407000 19498
1911 18.4

93863000 17271
1912 17.6 139 0.13 95335000 16779 132516
1913 18.1 142.1 0.13 97225000 17598 138157
1914 17.2 152.5 0.11 99111000 17047 151144
1915 15.2 132.7 0.11 100546000 15283 133425
1916 13.9 129.2 0.11 101961000 14173 131734
1917 15.6 133 0.12 103268000 16110 137346
1918 14 101.5 0.14 103208000 14449 104756
1919 14.9 144.7 0.1 104514000 15573 151232
1920 15.3 139 0.11 106461000 16289 147981
1921 17.7 190.7 0.09 108538000 19211 206982
1922 14.6 156.7 0.09 110049000 16067 172447
1923 12 131.4 0.09 111947000 13434 147098
1924 9.3 105.6 0.09 114109000 10612 120499
1925 7.8 82.1 0.1 115829000 9035 95096
1926 7.4 80.7 0.09 117397000 8687 94739
1927 7.7 89.8 0.09 119035000 9166 106893
1928 7.2 75.9 0.09 120509000 8677 91466
1929 6.5 70.1 0.09 121767000 7915 85359
1930 4.9 54.1 0.09 123077000 6031 66585
1931 4.8 57.1 0.08 124040000 5954 70827
1932 4.4 48 0.09 124840000 5493 59923
1933 3.9 40.2 0.1 125579000 4898 50483
TABLE 1. Death rate and incidence for diphtheria in the US from 1900-1970 (where available)
1934 3.3 34.1 0.1 126374000 4170 43094
(data expressed as per 100,000 of population)


1935 3.1 30.8 0.1 127250000 3945 39193
1936 2.4 23.4 0.1 128053000 3073 29964
1937 2 22.2 0.09 128825000 2577 28599
1938 2 23.5 0.09 129825000 2597 30509
1939 1.5 18.4 0.08 130880000 1963 24082
1940 1.1 11.8 0.09 131954000 1451 15571
1941 1 13.5 0.07 133121000 1331 17971
1942 1 12.1 0.08 134245000 1342 16244
1943 0.9 11 0.08 132885000 1196 14617
1944 0.9 10.6 0.08 132481000 1192 14043
1945 1.2 14.1 0.09 140054000 1681 19748
1946 0.9 11.7 0.08 143446000 1291 16783
1947 0.6 8.5 0.07 146093000 877 12418
1948 0.4 6.5 0.06 148665000 595 9663
1949 0.4 5.4 0.07 151235000 605 8167
1950 0.3 8.8 0.03 153310000 460 13491
1951 0.2 2.6 0.08 155687000 311 4048
1952 0.1 1.9 0.05 158242000 158 3007
1953 0.1 1.5 0.07 161164000 161 2417
1954 0.1 1.3 0.08 164308000 164 2136
1955 0.1 1.2 0.08 167306000 167 2008
1956 0.1 0.9 0.11 170371000 170 1533
1957
0.7
173320000
1213
1958
0.5
176289000
881
1959
0.5
177135000
886
1960
0.5
179979000
900
1961
0.3
182992000
549
1962
0.2
185771000
372
1963
0.2
188483000
377
TABLE 2. Deaths and incidence for diphtheria in the US from 1900-1970 (where available)
1964
0.2
191141000
382


1965
0.1
193526000
194


1966
0.1
195576000
196


1967
0.1
197457000
197


1968
0.1
199399000
199


1969
0.1
201385000
201


1970
0.2
203810000
408


Data less than 0.05 entered as 0 from 1957


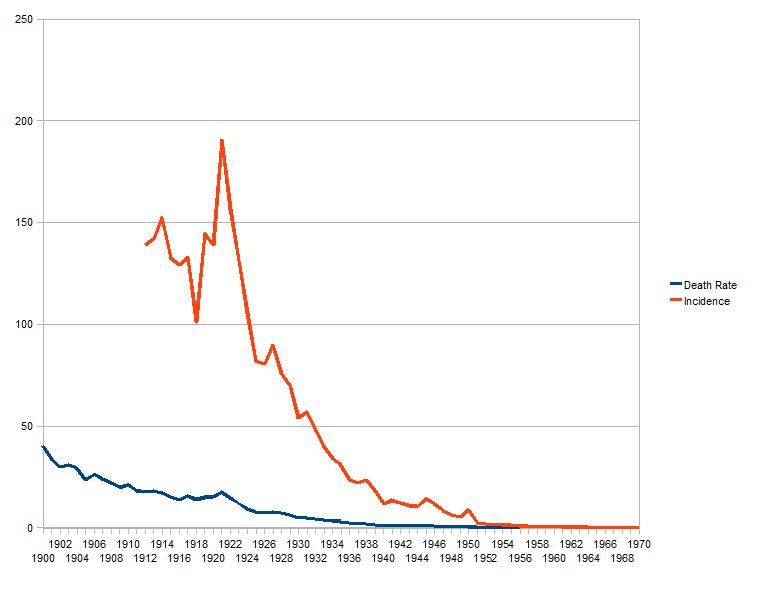
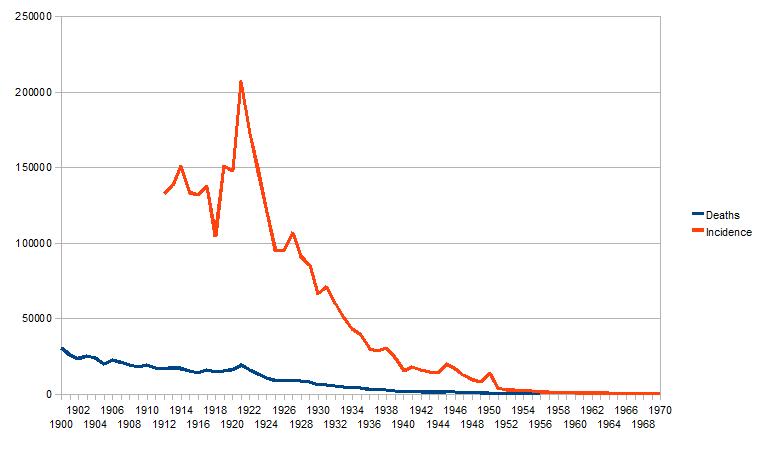
Three major changes in the management of diphtheria contributed to the fall in the death rate. In the 1880s Joseph O'Dwyer developed tubes that were inserted into the throat, and prevented victims from suffocating due to the membrane sheath that grows over and obstructs airways. In the 1890s, the German physician Emil von Behring developed an antitoxin that did not kill the bacterium, but neutralized the toxic poisons that the bacterium releases into the body. Von Behring discovered that animal blood has antitoxins in it and so he took the blood, removed the clotting agents and injected it into human patients. The vaccine against diphtheria in the US, which appeared in the early 1920s, was responsible for the gradual reduction in incidence from the 1920s through to 1970. In the United States there were 52 reported cases of diphtheria between 1980 and 2000; between 2000 and 2007 there were only three cases as the DPT (Diphtheria - Pertussis - Tetanus) vaccine is recommended for all school-age children.


10: Whooping Cough in US (1900-1970)

Deaths Rates and Incidence in the US (1900-1970)


Whooping Cough (Pertussis)


Death Rate Incidence Fatality Rate Resident Pop Deaths Incidence
1900 12.2

76094000 9283
1901 8.7

77584000 6750
1902 12.4

79163000 9816
1903 14.3

80632000 11530
1904 5.8

82266000 4771
1905 8.9

83822000 7460
1906 16.1

85450000 13757
1907 11.3

87008000 9832
1908 10.7

88710000 9492
1909 10

90490000 9049
1910 11.6

92407000 10719
1911 11

93863000 10325
1912 9.2

95335000 8771
1913 10.1

97225000 9820
1914 10.2

99111000 10109
1915 8.2

100546000 8245
1916 10.5

101961000 10706
1917 10.5

103268000 10843
1918 17

103208000 17545
1919 5.6

104514000 5853
1920 12.5

106461000 13308
1921 9.1

108538000 9877
1922 5.5 97.7 0.056 110049000 6053 107518
1923 9.6 146.7 0.065 111947000 10747 164226
1924 8.1 145 0.056 114109000 9243 165458
1925 6.7 131.2 0.051 115829000 7761 151968
1926 8.8 172.2 0.051 117397000 10331 202158
1927 6.8 152.4 0.045 119035000 8094 181409
TABLE 1. Death rate and incidence for whooping cough (pertussis) in the US from 1900-1970 (where available)
1928 5.4 134.3 0.040 120509000 6507 161844
(data expressed as per 100,000 of population)


1929 6.2 162.1 0.038 121767000 7550 197384

1930 4.8 135.6 0.035 123077000 5908 166892
1931 3.9 139.1 0.028 124040000 4838 172540
1932 4.5 172.5 0.026 124840000 5618 215349
1933 3.6 142.6 0.025 125579000 4521 179076
1934 5.9 209.9 0.028 126374000 7456 265259
1935 3.7 141.9 0.026 127250000 4708 180568
1936 2.1 115 0.018 128053000 2689 147261
1937 3.9 166.6 0.023 128825000 5024 214622
1938 3.7 175.1 0.021 129825000 4804 227324
1939 2.3 140 0.016 130880000 3010 183232
1940 2.2 139.6 0.016 131954000 2903 184208
1941 2.8 166.9 0.017 133121000 3727 222179
1942 1.9 142.9 0.013 134245000 2551 191836
1943 2.5 142.9 0.017 132885000 3322 189893
1944 1.4 82.7 0.017 132481000 1855 109562
1945 1.3 101 0.013 140054000 1821 141455
1946 0.9 78.4 0.011 143446000 1291 112462
1947 1.4 109.1 0.013 146093000 2045 159387
1948 0.8 61.7 0.013 148665000 1189 91726
1949 0.5 46.7 0.011 151235000 756 70627
1950 0.7 80.1 0.009 153310000 1073 122801
1951 0.6 44.8 0.013 155687000 934 69748
1952 0.1 28.9 0.003 158242000 158 45732
1953 0.2 23.5 0.009 161164000 322 37874
1954 0.2 37.8 0.005 164308000 329 62108
1955 0.1 38.2 0.003 167306000 167 63911
1956 0.3 19 0.016 170371000 511 32370
1957 0.1 16.6 0.006 173320000 173 28771
TABLE 2. Deaths and incidence for whooping cough (pertussis) in the US from 1900-1970 (where available)
1958 0.1 18.6 0.005 176289000 176 32790


1959 0.2 22.7 0.009 177135000 354 40210


1960 0.1 8.3 0.012 179979000 180 14938


1961
6.3
182992000
11528


1962
9.6
185771000
17834


1963
9.1
188483000
17152


1964
6.8
191141000
12998


1965
3.5
193526000
6773


1966
3.9
195576000
7627


1967
4.9
197457000
9675


1968
2.4
199399000
4786


1969
1.6
201385000
3222


1970
2.1
203810000
4280


data less than 0.05 shown as 0 from 1961


Wikipedia (http://en.wikipedia.org/wiki/Pertussis)


Pertussis, also known as the whooping cough, is a highly contagious disease caused by the bacterium Bordetella pertussis. It derived its name from the "whoop" sound made from the inspiration of air after a cough. A similar, milder disease is caused by B. parapertussis. Although many medical sources describe the whoop as "high-pitched", this is generally the case with infected babies and children only, not adults.


Before vaccines, an average of 157 cases per 100,000 persons were reported in the U.S., with peaks reported every two to five years; more than 93% of reported cases occurred in children under 10 years of age. The actual incidence was likely much higher. After vaccinations were introduced in the 1940s, incidence fell dramatically to less than 1 per 100,000 by 1970. Incidence rates have increased somewhat since 1980. Pertussis is the only vaccine-preventable disease that is associated with increasing deaths in the U.S. The number of deaths increased from 4 in 1996 to 17 in 2001, almost all of which were infants under one year


11: Measles in US (1900-1970)

Deaths Rates and Incidence in the US (1900-1970)


Measles


Death Rate Incidence Fatality Rate Resident Pop Deaths Incidence
1900 13.3

76094000 10121
1901 7.4

77584000 5741
1902 9.3

79163000 7362
1903 8.8

80632000 7096
1904 11.3

82266000 9296
1905 7.4

83822000 6203
1906 12.9

85450000 11023
1907 9.6

87008000 8353
1908 10.6

88710000 9403
1909 10

90490000 9049
1910 12.4

92407000 11458
1911 9.9

93863000 9292
1912 7.2 310 0.023 95335000 6864
1913 12.8 368.5 0.035 97225000 12445
1914 6.8 295.8 0.023 99111000 6740
1915 5.2 254.1 0.020 100546000 5228
1916 11.4 621.8 0.018 101961000 11624
1917 14.1 611.6 0.023 103268000 14561
1918 10.8 474.9 0.023 103208000 11146
1919 3.9 203.2 0.019 104514000 4076
1920 8.8 480.5 0.018 106461000 9369
1921 4.2 274.5 0.015 108538000 4559
1922 4.3 241.8 0.018 110049000 4732 266098
1923 10.7 680 0.016 111947000 11978 761240
1924 8.2 463.7 0.018 114109000 9357 529123
1925 2.3 194.3 0.012 115829000 2664 225056
TABLE 1. Death rate and incidence for measles in the US from 1900-1970 (where available)
1926 8.3 587.1 0.014 117397000 9744 689238
(data expressed as per 100,000 of population)


1927 4.1 387.6 0.011 119035000 4880 461380


1928 5.2 466.3 0.011 120509000 6266 561933
1929 2.5 300.6 0.008 121767000 3044 366032
1930 3.2 340.8 0.009 123077000 3938 419446
1931 3 382.8 0.008 124040000 3721 474825
1932 1.6 323.2 0.005 124840000 1997 403483
1933 2.2 319.2 0.007 125579000 2763 400848
1934 5.5 682.6 0.008 126374000 6951 862629
1935 3.1 584.6 0.005 127250000 3945 743904
1936 1 234 0.004 128053000 1281 299644
1937 1.2 249.6 0.005 128825000 1546 321547
1938 2.5 633.8 0.004 129825000 3246 822831
1939 0.9 308.2 0.003 130880000 1178 403372
1940 0.5 220.7 0.002 131954000 660 291222
1941 1.7 671.7 0.003 133121000 2263 894174
1942 1 408.8 0.002 134245000 1342 548794
1943 1 472 0.002 132885000 1329 627217
1944 1.4 474.3 0.003 132481000 1855 628357
1945 0.2 110.2 0.002 140054000 280 154340
1946 0.9 496.8 0.002 143446000 1291 712640
1947 0.8 155 0.005 146093000 1169 226444
1948 0.6 421 0.001 148665000 892 625880
1949 0.6 420.6 0.001 151235000 907 636094
1950 0.9 210.1 0.004 153310000 1380 322104
1951 0.4 345.6 0.001 155687000 623 538054
1952 0.4 438.5 0.001 158242000 633 693891
1953 0.8 283.7 0.003 161164000 1289 457222
1954 0 423.5 0.000 164308000 0 695844
1955 0.2 337.9 0.001 167306000 335 565327
1956
365.9
170371000
623387
TABLE 2. Deaths and incidence for measles in the US from 1900-1970 (where available)
1957
285.9
173320000
495522


1958
440.5
176289000
776553


1959
230.1
177135000
407588


1960
245.4
179979000
441668


1961
231.6
182992000
423809


1962
259
185771000
481147


1963
204.2
188483000
384882


1964
239.4
191141000
457592


1965
135.1
193526000
261454


1966
104.2
195576000
203790


1967
31.7
197457000
62594


1968
11.1
199399000
22133


1969
12
201385000
24166


1970
23.4
203810000
47692


data from 1956 displays less than 0.05 as 0


Wikipedia (http://en.wikipedia.org/wiki/Measles)


Measles is spread through respiration (contact with fluids from an infected person's nose and mouth, either directly or through aerosol transmission), and is highly contagious—90% of people without immunity sharing a house with an infected person will catch it. The infection has an average incubation period of 14 days (range 6–19 days) and infectivity lasts from 2–4 days prior, until 2–5 days following the onset of the rash (i.e. 4–9 days infectivity in total).


Licensed vaccines to prevent measles became available in 1963. However, when vaccination rates drop outbreaks can still occur as evidenced in the Wikipedia article.


12: Massachusetts - Infectious Desease Data (1860-1970)

Data of death rate (deaths/100,000 of population) for Massachusetts (1860-1970)


Tuberculosis Diphtheria Typhoid/Para Measles Smallpox


1970 2.4 0 0.05 0.05 0


1969 2.4 0 0 0.05 0


1968 2.9 0 0.05 0.05 0


1967 3.5 0 0.05 0 0


1966 3.3 0 0.05 0 0


1965 4 0 0.05 0.1 0


1964 3.3 0 0.03 0.05 0


1963 4.4 0.05 0.05 0 0


1962 4.8 0 0.05 0.1 0


1961 5.7 0 0.1 0.05 0


1960 6 0 0.05 0.1 0


1959 6.6 0 0.05 0.1 0


1958 6.5 0 0.05 0.1 0


1957 8.2 0.05 0 0.1 0


1956 8.6 0.1 0.05 0.05 0.05


1955 9.3 0.05 0.05 0.4 0.05


1950 20.2 0.2 0.05 0.05 0.05


1945 36.9 0.3 0.1 0.2 0.05


1940 34.6 0.2 0.2 0.3 0.05


1935 42.9 0.7 0.3 0.8 0.05


1930 57.2 4.3 0.9 3.3 0.05


1925 70.1 8 1.8 8.4 0.05


1920 96.8 15.1 2.4 9.1 0.1


1915 116.8 19.8 6.7 7.3 0.3


1910 138.3 21 12.5 11.6 0.05


1905 163.5 22.1 17.9 8.4 0.1


1900 190.3 52.8 22.1 11.7 0.1


1899 190.4 33.2 22.3 8.8 0.5


1898 197.4 26.4 24.7 3.1 0.05


1897 207.4 54.5 23.2 6 0.2


1896 216.4 65.5 28.3 5.4 0.05


1895 223.4 71.4 27.2 4.7 0.05


1894 223.4 73.6 30.6 4 1.3


1893 231 58.3 31.4 11.5 0.4


1892 244.8 62.2 35.3 3.8 0.1


1891 239.6 53.2 35.9 10.3 0.1


1890 258.6 72.6 37.3 5.1 0


1889 256.5 101.7 40.9 7.9 0.05


1888 270.8 86.6 44.6 10.4 0.3


1887 285.6 79.2 44.8 22.1 0.1


1886 295.1 78 40 6.5 0.05


1885 306.6 78.4 39.5 16.1 1


1884 303.6 86.2 45.8 3.9 0.2


1883 316 86.4 45.8 17.1 0.3


1882 317.9 96 58.5 3.7 2.4


1881 324.5 131.4 59.1 12.7 2.6


1880 308.1 134.3 49.5 13.2 2.1


1879 297.4 180.6 36.3 1.1 0.4


1878 308.4 145.5 39.3 17.6 0.1


1877 320.4 186.6 47.8 7.9 1.4


1876 317.6 196.4 52.5 2.8 1.8


1875 347.4 113.8 64.1 14.1 2.1


1874 328 56.7 71.2 10 1.6


1873 353.6 47.4 89.5 11.5 42.5


1872 362.6 49.1 111.1 27.9 67.2


1871 339.3 50 74.7 8.8 19.7


1870 343.3 46.4 91.5 18.5 9


1869 328.8 54.3 85 15.7 4.2


1868 322 56.7 65 20.8 1.5


1867 325.5 45.3 72 14.5 14.6


1866 353 63.7 83.7 8.4 10.8


1865 367.9 92.8 133.7 10.7 17.4


1864 375.7 158.7 106.7 25.4 19.2


1863 372.6 182.4 115.1 11.3 3.4


1862 342.8 92.1 91.1 29.6 3.2


1861 365.2 89.2 79.9 16.9 2.7


1860
68 76.1 18.2 27.1


Massachusetts Death Rates (deaths/100,000 population)
US Death Rates (deaths/100,000 population)


Tuberculosis (Mass) Diphtheria (Mass) Typhoid/Para (Mass) Measles (Mass) Tuberculosis (US) Diphtheria (US) Typhoid/Para (US) Measles (US) Population (Mass)

1865 367.9 92.8 133.7 10.7


1870 343.3 46.4 91.5 18.5


1457351

1875 347.4 113.8 64.1 14.1


1880 308.1 134.3 49.5 13.2


1783085

1885 306.6 78.4 39.5 16.1


1890 258.6 72.6 37.3 5.1


2238947

1895 223.4 71.4 27.2 4.7


1900 190.3 52.8 22.1 11.7 194.4 40.3 31.3 13.3 2805346

1905 163.5 22.1 17.9 8.4 179.9 23.5 22.4 7.4


1910 138.3 21 12.5 11.6 153.8 21.1 22.5 12.4 3366416

1915 116.8 19.8 6.7 7.3 140.1 15.2 31.8 5.2


1920 96.8 15.1 2.4 9.1 113.1 15.3 7.6 8.8 3852356

1925 70.1 8 1.8 8.4 84.8 7.8 7.8 2.3


1930 57.2 4.3 0.9 3.3 71.1 4.9 4.8 3.2 4249614

1935 42.9 0.7 0.3 0.8 55.1 3.1 2.8 3.1


1940 34.6 0.2 0.2 0.3 46.9 1.1 1.1 0.5 4316721

1945 36.9 0.3 0.1 0.2 39 1.2 0.4 0.2


1950 20.2 0.2 0.05 0.05 22 0.3 0.1 0.9 4690514

1955 9.3 0.05 0.05 0.4 9.3 0.1 1 0.2


1960 0.6 0 0.05 0.1 6 0 0 0 5148578

1965 4 0 0.05 0.1 4 0 0 0


1970 2.4 0 0.05 0.05 2 0 0 0 5689170


Table 1. Comparison of Death Rates in Massachusetts and the US as a whole


(data expressed per 100,000 of the population)